Reason to trust
How Our News is Made
Strict editorial policy that focuses on accuracy, relevance, and impartiality
Ad discliamer
Morbi pretium leo et nisl aliquam mollis. Quisque arcu lorem, ultricies quis pellentesque nec, ullamcorper eu odio.
Key Highlights
- ETH price recovered well after a monstrous collapse against the US Dollar to trade towards $11.50.
- The price failed to remain in the bullish trend, and currently moving lower.
- There is a short-term bullish trend line formed on the hourly chart (data feed via SimpleFX) of ETH/USD, which is acting as a support area.
Ethereum price after a decent recovery against the US Dollar started moving down. Does this mean a correction is over in ETH/USD?
Ethereum Price Support
ETH price managed to spike higher after trading as low as $9.23 against the US Dollar. The ETH/USD pair climbed higher and traded as high as $11.35, but it found sellers near the 200 hourly simple moving average, which acted as a barrier. The price is once again moving lower, and already traded below the 100 hourly simple moving average. Moreover, there was also a close below the 23.6% Fib retracement level of the last leg from the $9.23 low to $11.35 high.
So, this means the price may move further down. There are a few support levels on the downside. First, there is a short-term bullish trend line formed on the hourly chart (data feed via SimpleFX) of ETH/USD. Second, the 38.2% Fib retracement level of the last leg from the $9.23 low to $11.35 high is around the same trend line. Lastly, the $10.50 support area is crucial.
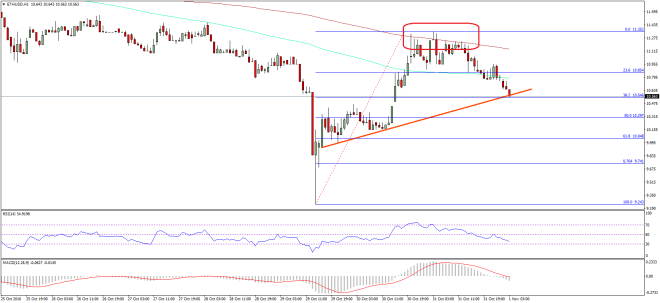
So, if the trend line acts as a perfect support, there is a chance of a bounce back. If there is a break below it, then the price may turn bearish once again. Let us see how it trades today, and whether it can bounce or not.
Hourly MACD – The MACD has changed the slope to the bearish zone.
Hourly RSI – The RSI is now below the 50 level, which is not a good sign for the buyers.
Major Support Level – $10.50
Major Resistance Level – $11.00
Charts courtesy – SimpleFX