
Key Highlights
- ETH price corrected sharply lower after trading to a new high at $864.53 against the US Dollar.
- A bullish trend line with current support at $715 acted as a buy zone on the hourly chart of ETH/USD (data feed via SimpleFX).
- The pair is currently moving higher and is attempting an upside break above $800.
Ethereum price is placed nicely in the bullish zone against the US Dollar and Bitcoin. ETH/USD may soon break $800-805 once again for more gains.
Ethereum Price Support
There were heavy swing moves in ETH price recently above $700 against the US Dollar. The price gained solid momentum, moved above the $800 level and traded to a new high at $864.53. Later, the price failed to retain momentum and started a downside below $800. There was a sharp downside reaction and the price broke the $750 and $720 support levels as well. The decline was nasty and the price finally found support around $700 and the 100 hourly simple moving average.
Moreover, a bullish trend line with current support at $715 acted as a buy zone on the hourly chart of ETH/USD. The pair is now moving back higher and it currently above the 50% Fib retracement level of the last decline from the $864 high to $702 low. However, there is a bearish trend line on the same chart with resistance at $805-810. ETH buyers need to break the $810 resistance to push the price back in the bullish zone. Moreover, a break above the 61.8% Fib retracement level of the last decline from the $864 high to $702 low is needed to a push toward the $850 level.
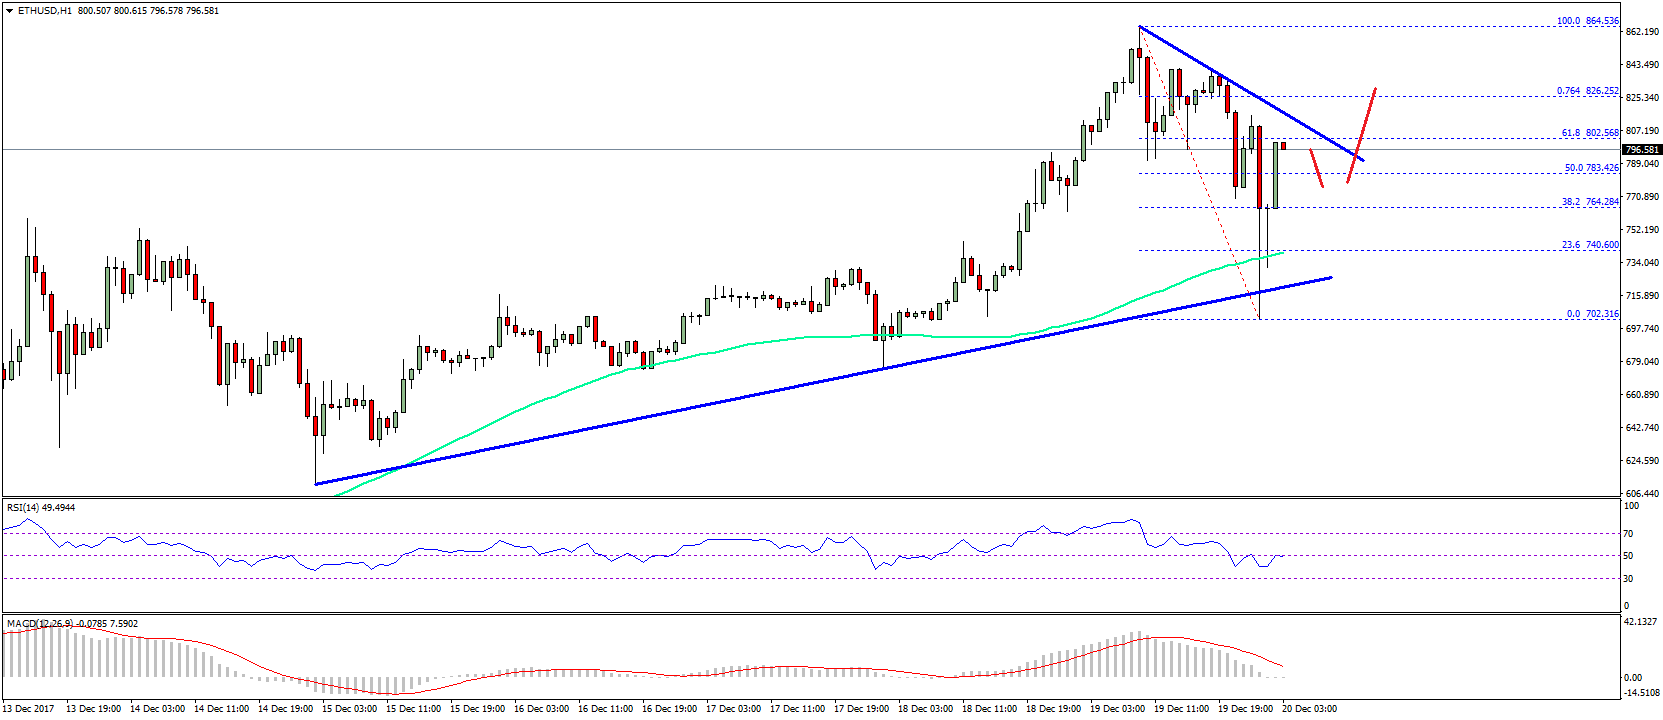
On the downside, the trend line support at $715 is important along with the 100 hourly SMA.
Hourly MACD – The MACD has just moved into the bearish zone.
Hourly RSI – The RSI is currently attempting an upside break above the 50 level.
Major Support Level – $715
Major Resistance Level – $810
Charts courtesy – SimpleFX