Reason to trust
How Our News is Made
Strict editorial policy that focuses on accuracy, relevance, and impartiality
Ad discliamer
Morbi pretium leo et nisl aliquam mollis. Quisque arcu lorem, ultricies quis pellentesque nec, ullamcorper eu odio.
Key Highlights
- Ethereum price continued to move higher vs the US Dollar and reached my final target of $10.40.
- There is now a bullish trend line formed on the hourly chart (data feed via Kraken) of ETH/USD, which may act as a support if the price moves down.
- The price has already started correcting lower, and it would be interesting to see how far it can go.
Ethereum price traded further higher yesterday, and reached my final target of $10.40. Now can it correct and trade higher once again?
Ethereum Price Trend Line Support
Ethereum price ETH after settling above the $10.00 resistance area surged higher and even managed to climb towards the last swing high of $10.40, which was my final target of longs. The price traded as high as $10.54 vs the US Dollar, and then started to correct lower. There are many support levels formed on the downside, which may act as a hurdle for the ETH sellers.
First, there is a very important bullish trend line formed on the hourly chart (data feed via Kraken) of ETH/USD, which is also coinciding with the 100 hourly simple moving average. So, we can say that there is a monster support formed on the downside at $9.70-80, which can also be considered as a buy area. An initial support on the downside is around the 38.2% Fib retracement level of the last leg from the $8.98 low to the $10.54 high.
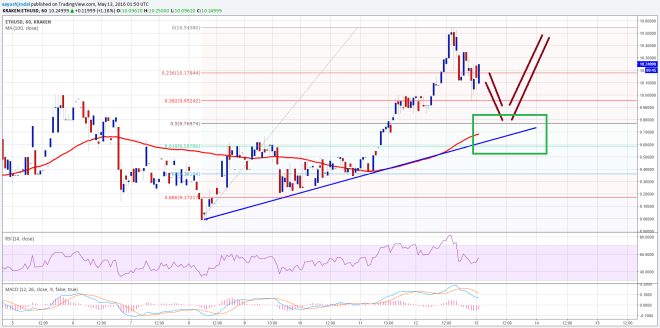
However, as mentioned the most important support is around the highlighted trend line since is also positioned with the 50% Fib retracement level of the last leg from the $8.98 low to the $10.54 high.
Hourly MACD – The MACD is in the bearish slope, signaling chances of a correction in the short term.
Hourly RSI – The RSI is still above the 50 level, which is a sign that ETH bulls are in control.
Intraday Support Level – $9.80
Intraday Resistance Level – $10.50
Charts courtesy of Kraken via Trading View
Image Header NewsBTC