Reason to trust
How Our News is Made
Strict editorial policy that focuses on accuracy, relevance, and impartiality
Ad discliamer
Morbi pretium leo et nisl aliquam mollis. Quisque arcu lorem, ultricies quis pellentesque nec, ullamcorper eu odio.
Key Highlights
- Ethereum price failed once again to trade near the $15.00 level vs the US dollar and moved down.
- Yesterday’s highlighted bullish trend line on the hourly chart (data feed via Kraken) of ETH/USD was broken during the downside drift.
- Two failures to trade and break $15.00 suggests that the price is starting to feel the heat in the short term.
Ethereum price may trade down if the ETH/USD bulls fail once again to take it close to the $15.00 level moving ahead.
Ethereum Price to Weaken?
Ethereum price ETH yesterday attempted to trade higher, but failed to near the $14.40 level vs the US Dollar. I was hoping it to test at least the last swing high of $14.80. However, the ETH sellers had a different idea, as they managed to outpace the bulls and took the price down. Yesterday’s highlighted bullish trend line on the hourly chart (data feed via Kraken) of ETH/USD was breached to ignite a downside move.
The most important point is that the price has now registered two failures around the $14.50 level, which is a warning to the bulls that a top may be in place. However, there are many support levels on the downside for the price, which may act as a hurdle for sellers if it moves down from the current levels.
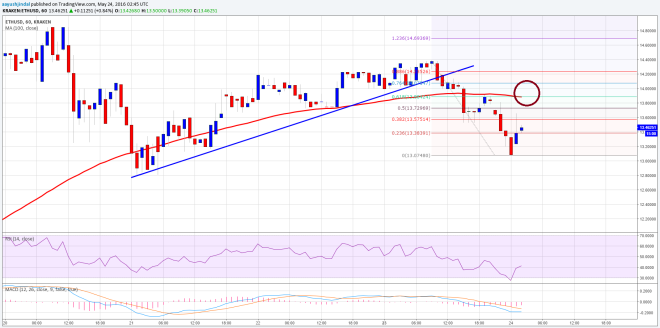
If the price moves higher, then an initial resistance is around the 38.2% Fib retracement level of the last drop from the $14.40 high to $13.07 low. However, the most important resistance is near the 100 hourly simple moving average, which is sitting along with the 50% Fib retracement level of the same drop. One may even consider selling near it with a stop above the 100 hourly SMA.
Hourly MACD – The MACD is in the bearish zone, which is a negative sign.
Hourly RSI – The RSI is below the 50 level, calling for more weakness in the near term.
Intraday Support Level – $13.10
Intraday Resistance Level – $14.00
Charts courtesy of Kraken via Trading View
Header Image via NewsBTC