
Reason to trust
How Our News is Made
Strict editorial policy that focuses on accuracy, relevance, and impartiality
Ad discliamer
Morbi pretium leo et nisl aliquam mollis. Quisque arcu lorem, ultricies quis pellentesque nec, ullamcorper eu odio.
Key Highlights
- Ethereum price moved down sharply and traded close to the $10.0 level against the US Dollar.
- There was a bullish trend line formed on the 4-hours chart (data feed via Kraken) of ETH/USD, which was breached during the downside move.
- The price is currently trading around the 100 simple moving average (H4), which may play a major role for the next move.
Ethereum price declined heavily due to the DAO hack, and lost around 40% of the value. Can losses stop in ETH or will it continue to move down?
Ethereum Price Decline
Ethereum price ETH fell like a stone during the past few hours against the US Dollar, and the main reason was the DAO hack, which ignited a sharp decline in the price. ETH/USD after trading as high as $21.00 found sellers and after the DAO hack report, it fell below the $16.00 level. Recently, the price traded towards the $10.0 level where the bulls are fighting to prevent any further declines.
During the downside move, the price broke a bullish trend line formed on the 4-hours chart (data feed via Kraken) of ETH/USD. The price is currently attempting to settle below the 100 simple moving average (H4), but it may not be easy for the sellers.
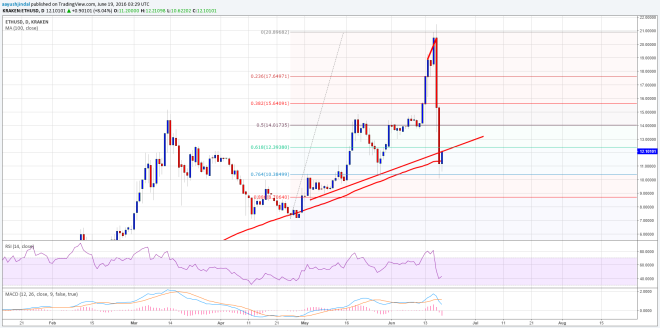
I think the 100 SMA holds the key for ETH/USD in the short term, and as long as the price do not settle below it, there is a chance of a minor recovery (as a part of a correction). No doubt, the price is under a lot of pressure and may continue to trade with a negative bias for some time.
4-hours MACD – The MACD is in the bearish slope, which is a bearish sign.
4-hours RSI – The RSI is around the 40 level, pointing towards weakness in ETH.
Weekly Support Level – $10.40
Weekly Resistance Level – $14.00
Charts courtesy of Kraken via Trading View


