Reason to trust
How Our News is Made
Strict editorial policy that focuses on accuracy, relevance, and impartiality
Ad discliamer
Morbi pretium leo et nisl aliquam mollis. Quisque arcu lorem, ultricies quis pellentesque nec, ullamcorper eu odio.
Key Highlights
- ETH price continued its downward move against the US Dollar and created a new low as forecasted yesterday.
- This week’s long followed bearish trend line on the hourly chart (data feed via SimpleFX) of ETH/USD is still active and acting as a resistance.
- The price action is not shaping up well, which means it may be the right time for sellers to step back.
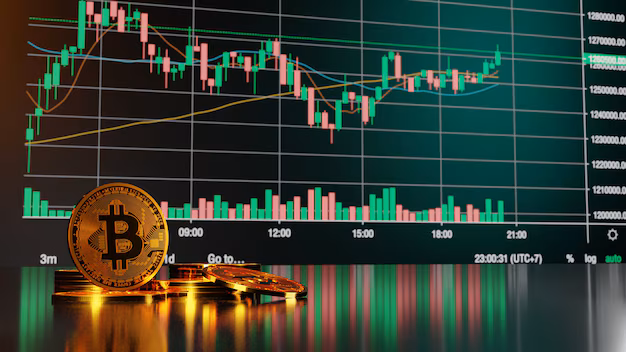
Ethereum price ETH declined further to create a new low versus the US Dollar. Can it continue to move down in the short term?
Ethereum Price Decline
Ethereum price ETH is in a downtrend versus the US Dollar as it can be clearly seen from the chart. However, this can be only a short-term trend. Once there is a bottom formed, we can see some recovery in ETH moving ahead. I have been tracking a bearish trend line on the hourly chart (data feed via SimpleFX) of ETH/USD during this week. It continued to act as a barrier for the ETH bulls, and prevented gains on many occasions.
There was a new low formed yesterday, as I was anticipating. I strongly feel the sellers are exhausted and may step back in time. So, if you are a seller, I think it may be the right time to book profits before there can be a reversal. The price is currently attempting to move above the 23.6% Fib retracement level of the last drop from the $12.33 high to $10.16 low.
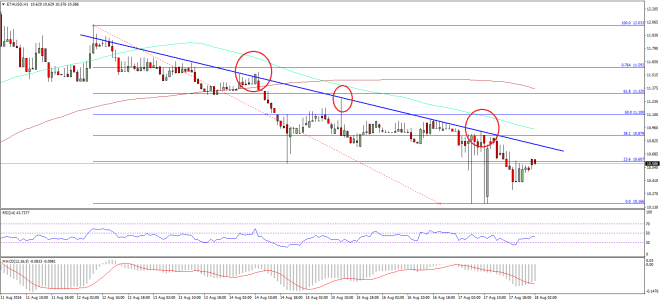
If the ETH bulls succeed in settling the price above the stated fib level, then the highlighted bearish trend line may be challenged once again. A break above it is needed for the bulls to be back in action.
Hourly MACD – The MACD is strongly bearish, and showing no signs of a recovery.
Hourly RSI – The RSI is moving away from the oversold readings, and may test the neutral level soon.
Major Support Level – $10.40
Major Resistance Level – $11.00
Charts courtesy – SimpleFX