
Reason to trust
How Our News is Made
Strict editorial policy that focuses on accuracy, relevance, and impartiality
Ad discliamer
Morbi pretium leo et nisl aliquam mollis. Quisque arcu lorem, ultricies quis pellentesque nec, ullamcorper eu odio.
Key Highlights
- ETH price after a couple of spikes lower against the US Dollar managed to recover.
- There is a new bearish trend line formed along with a support on the hourly chart (data feed via SimpleFX) of ETH/USD.
- A break either lower or higher is needed for the next move in ETH/USD.
Ethereum price managed to bounce a couple of times from the lows and currently attempting to break a major resistance area.
Ethereum Price Bearish Trend Line
Ethereum price ETH struggled during yesterday versus the US Dollar and traded lower on a few occasions. However, the ETH buyers appeared later and prevented a downside move. The price finally bounced and moved back above the $10.60 level. Currently, the buyers are attempting to break a bearish trend line on the hourly chart (data feed via SimpleFX) of ETH/USD.
The trend line is also positioned with the 100 hourly simple moving average. Moreover, the 50% Fib retracement level of the last drop from the $11.28 high to $10.52 low is also around the trend line. So, we can safely say that the price is currently trading near a major resistance area. If there is a break above the resistance, then there are chances of more upsides in the near term.
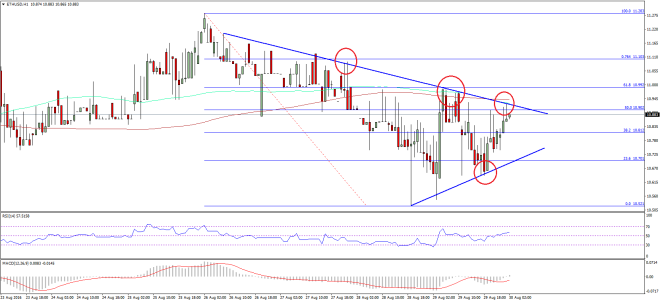
On the downside, there is a minor support trend line formed on the same chart. It may continue to act as a buying zone for the pair. There are a few positive signals on the charts, which may help the pair to break higher and trade above the $11.00 level. My view remains the same, we should avoid selling ETH at this point, and wait for a move higher.
Hourly MACD – The MACD just changed the slope from the bearish to bullish zone.
Hourly RSI – The RSI is also above the 30 level, which is a positive sign.
Major Support Level – $10.50
Major Resistance Level – $11.00
Charts courtesy – SimpleFX


