
Reason to trust
How Our News is Made
Strict editorial policy that focuses on accuracy, relevance, and impartiality
Ad discliamer
Morbi pretium leo et nisl aliquam mollis. Quisque arcu lorem, ultricies quis pellentesque nec, ullamcorper eu odio.
Key Highlights
- ETH price after failing to retain the bullish bias against the US Dollar failed and moved down.
- Yesterday’s highlighted bullish trend line on the hourly chart (data feed via SimpleFX) of ETH/USD was cleared by sellers during the recent downside.
- ETH bulls must trade carefully, as there is a chance of a downside move in the short term.
Ethereum price was trading above a short-term support versus the US Dollar until sellers appeared and took ETH/USD lower.
Ethereum Price Downside Move
Ethereum price looks like made a short-term top near $13.21 against the US Dollar. There was a move below the 38.2% Fib retracement level of the wave from the $12.59 low to $13.21 high, which ignited further downsides in ETH/USD. The most crucial point for the bulls is the fact that the price broke a couple of important support zones.
Yesterday, I highlighted a bullish trend line on the hourly chart (data feed via SimpleFX) of ETH/USD. During the recent downside move, the sellers managed to break It. Not only that, they also succeeded in breaking the 50% Fib retracement level of the wave from the $12.59 low to $13.21 high. At this moment, they are attempting for a close below the 100 hourly simple moving average. If they succeed, it will further increase the bearish pressure on the ETH buyers.
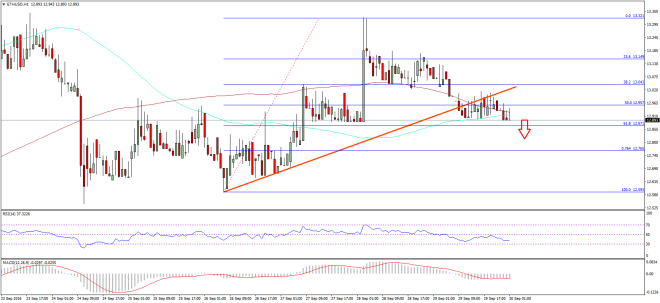
So, if you are a buyer, you need to trade carefully moving ahead. There is a chance of further declines in ETH/USD. In my view, there is even a possibility of a full test of the last swing low of $12.60. The technical indicators for ETH are turning south, which is a bearish call in the short term.
Hourly MACD – The MACD is now moved into the bullish zone.
Hourly RSI – The RSI is also below the 50 level, calling for more losses.
Major Support Level – $12.80
Major Resistance Level – $13.10
Charts courtesy – SimpleFX


