
Reason to trust
How Our News is Made
Strict editorial policy that focuses on accuracy, relevance, and impartiality
Ad discliamer
Morbi pretium leo et nisl aliquam mollis. Quisque arcu lorem, ultricies quis pellentesque nec, ullamcorper eu odio.
Key Highlights
- ETH price continued to face sellers against the US Dollar and Bitcoin, and likely to form a new low.
- There is a major bearish trend line formed on the hourly chart (data feed via SimpleFX) of ETH/USD, which is acting as a resistance on the upside at $7.60.
- The pair may break the recent low of $7.16 for a test of the $7.00 handle in the short term.
Ethereum price may continue to decline against the USD and BTC, and the ETH/USD pair is likely to test the $7.00 support going forward.
Ethereum Price Decline
ETH price recently attempted a correction against the US Dollar, but failed to break the $7.60 resistance area. There were a lot of offers presented around the stated level, which resulted in a decline in ETH/USD. It is also important to note that there is a major bearish trend line formed on the hourly chart (data feed via SimpleFX) of ETH/USD. It acted as a resistance near the $7.60 level and pushed the price down.
The pair declined and broke a couple of important support levels. First, the 61.8% Fib retracement level of the last wave from the $7.16 low to $7.93 high was cleared. Second, the $7.30 support zone was also broken by the ETH sellers. Overall, the pair now remains at a risk of more declines. It is already trading near the last swing low of $7.16. If the ETH sellers manage to break it, then the 1.236 extension of the last wave from the $7.16 low to $7.93 high may be tested.
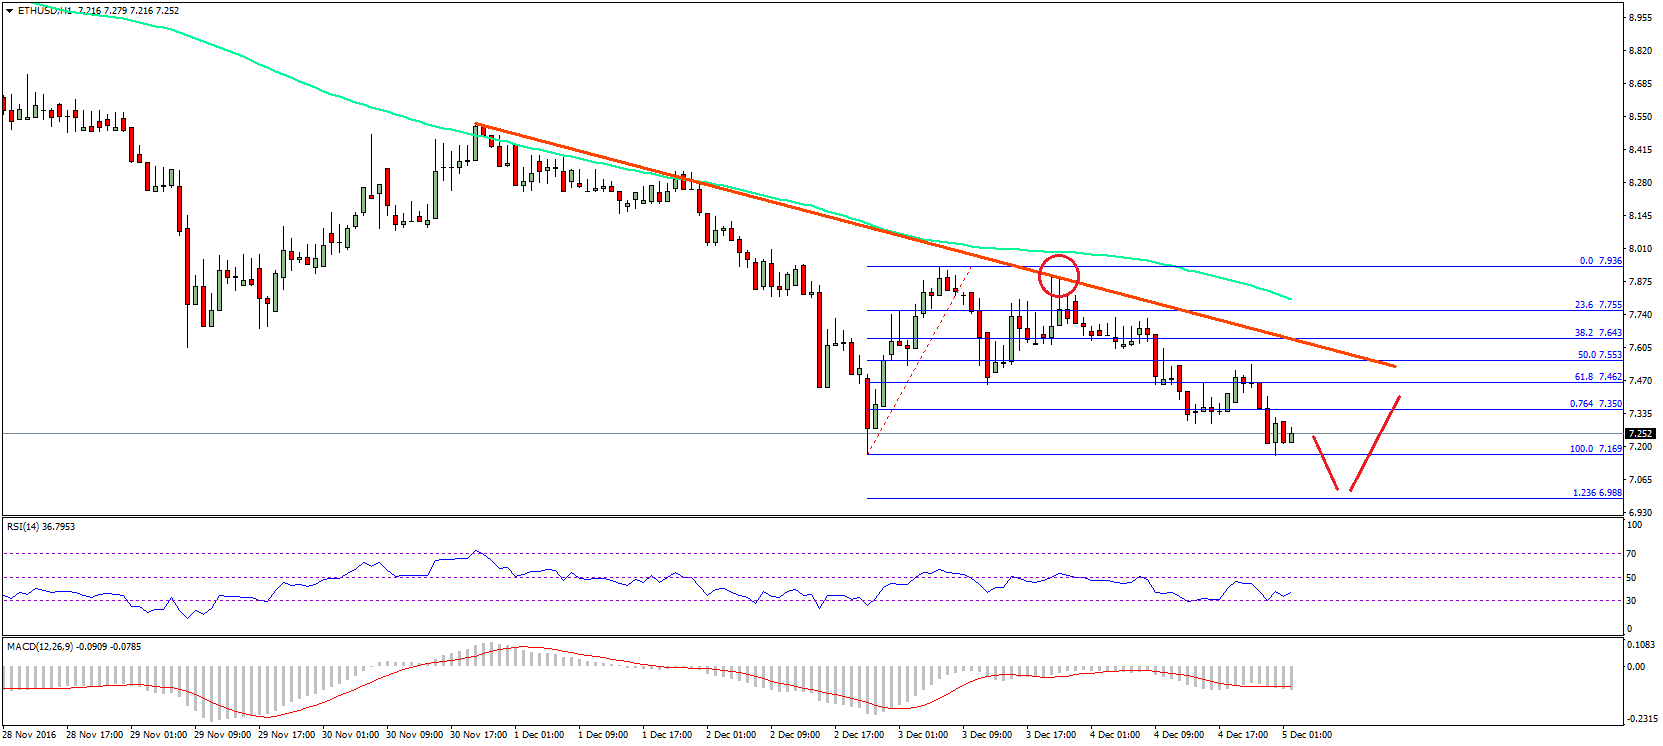
So, it looks like the price may decline further before it could find support near the $7.00 handle.
Hourly MACD – The MACD is well in the bearish zone, calling for more losses.
Hourly RSI – The RSI has reached the oversold readings, which is a bearish sign.
Major Support Level – $7.15
Major Resistance Level – $7.60
Charts courtesy – SimpleFX


