
Reason to trust
How Our News is Made
Strict editorial policy that focuses on accuracy, relevance, and impartiality
Ad discliamer
Morbi pretium leo et nisl aliquam mollis. Quisque arcu lorem, ultricies quis pellentesque nec, ullamcorper eu odio.
Key Highlights
- ETH price traded higher recently and managed to move above $326 against the US Dollar.
- There is a major bullish trend line forming with support at $322 on the hourly chart of ETH/USD (data feed via SimpleFX).
- The price might continue to gain bullish momentum and it could even break $335 for more gains.
Ethereum price is eyeing more gains against the US Dollar and Bitcoin. ETH/USD remains buy on dips near the $322 and $320 levels.
Ethereum Price Trend
There was a decent start of an uptrend in ETH price as it managed to break the $320 level against the US Dollar. The upside move gained traction and the price was able to break the $326 resistance as well. A new weekly high was formed near $335.42 from where a minor correction is initiated. The price is currently trading near the 23.6% Fib retracement level of the last wave from the $306.73 low to $335.42 high.
However, there are many supports on the downside near $320. An initial support is around the 38.2% Fib retracement level of the last wave from the $306.73 low to $335.42 high at $324.46. Below this last, there is a major bullish trend line forming with support at $322 on the hourly chart of ETH/USD. The trend line support is near the 50% Fib retracement level of the last wave from the $306.73 low to $335.42 high. As long as the price is above $320, it remains in an uptrend.
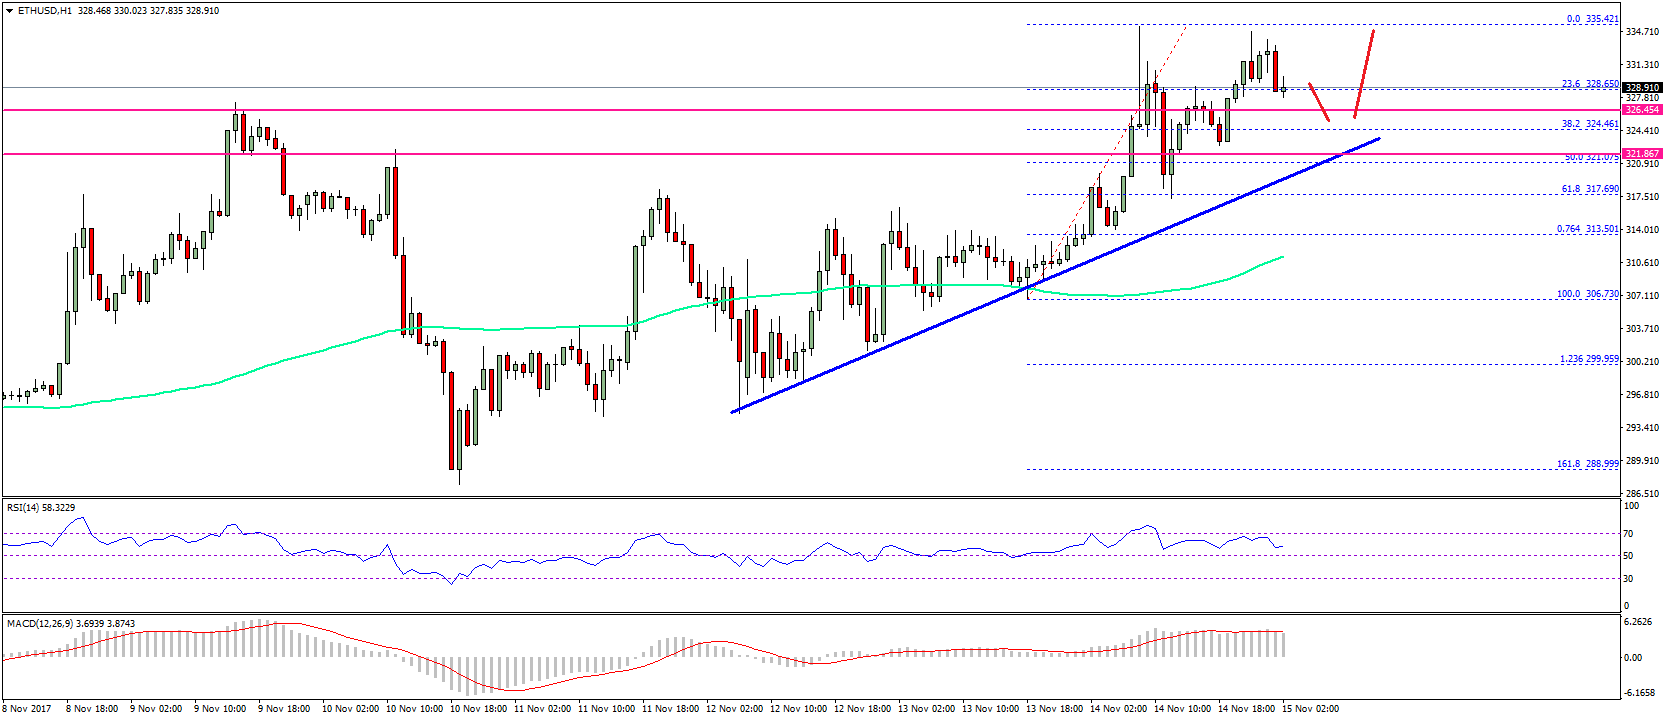
There are chances of ETH retesting the $335 level. If buyers remain in control, it could even break the $340 level in the near term. On the downside, the $322 and $320 levels are decent supports and buy zones.
Hourly MACD – The MACD is placed well in the bullish slope.
Hourly RSI – The RSI is currently well above the 50 level.
Major Support Level – $320
Major Resistance Level – $335
Charts courtesy – SimpleFX


