
Reason to trust
How Our News is Made
Strict editorial policy that focuses on accuracy, relevance, and impartiality
Ad discliamer
Morbi pretium leo et nisl aliquam mollis. Quisque arcu lorem, ultricies quis pellentesque nec, ullamcorper eu odio.
Key Points
- Bitcoin cash price is struggling to move above the $2600 and $2700 resistance levels against the US Dollar.
- There is a crucial bearish trend line forming with resistance at $2600 on the 4-hours chart of BCH/USD (data feed from Kraken).
- The pair has to move above the $2600 and $2700 levels to gain traction in the near term.
Bitcoin cash price is finding bids above the $2200 level against the US Dollar. BCH/USD must close above $2700 to move back in the bullish zone.
Bitcoin Cash Price Upside Hurdle
After a sharp downside move toward $2000, bitcoin cash price found support against the US Dollar. The price started a recovery and managed to settle above $2200. There were a couple of upside attempts, but it struggled to move above $2800 and then at $2700. It seems like there is a crucial bearish trend line forming with resistance at $2600 on the 4-hours chart of BCH/USD.
The mentioned trend line is acting as a major upside hurdle and prevented gains above $2700. The trend line at $2600-2700 is also around the 100 simple moving average on the same chart. Therefore, a break above $2700 and the 100 SMA won’t be easy. The pair is currently above the 50% Fib retracement level of the last drop from the $2880 high to $2281 low.
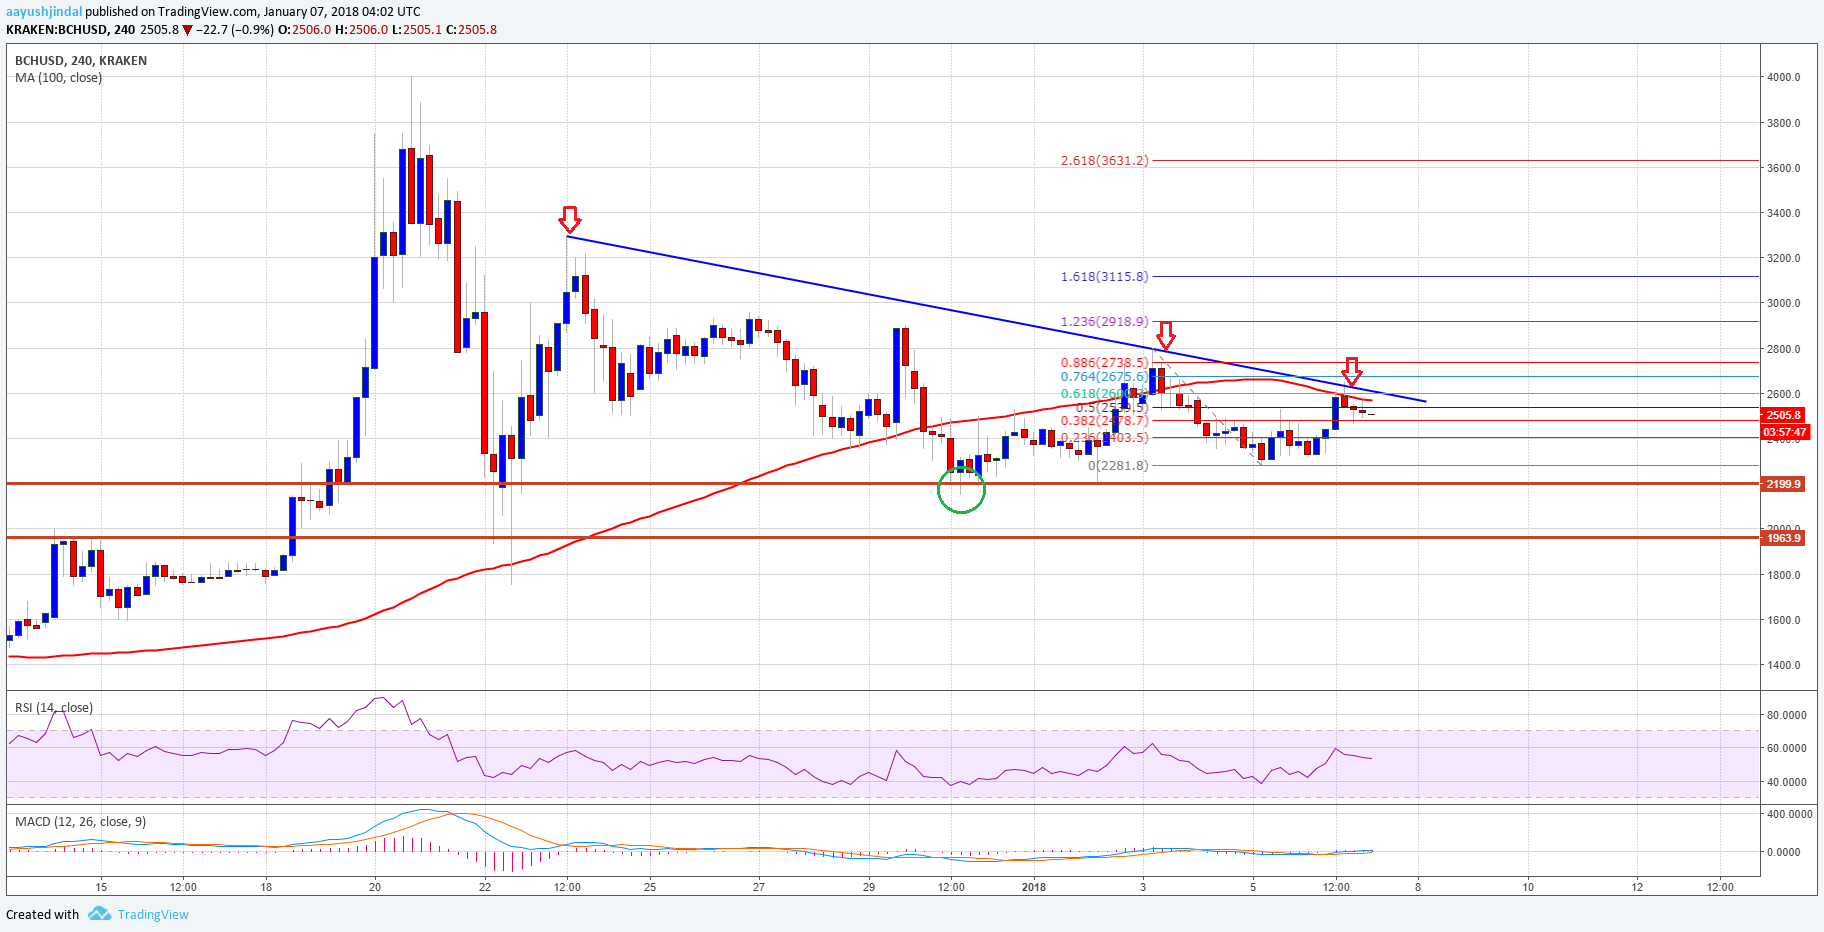
However, it has to move above $2700 and the 61.8% Fib retracement level of the last drop from the $2880 high to $2281 low to gain upside momentum. Once there is a close above the $2700 resistance and the 100 SMA, the price could accelerate toward $3000 and then $3200. On the downside, the $2200 and $2000 levels are important supports.
Looking at the technical indicators:
4-hours MACD – The MACD for BCH/USD is mostly flat and is showing signs of a range.
4-hours RSI (Relative Strength Index) – The RSI for BTC/USD is currently above the 50 level.
Major Support Level – $2200
Major Resistance Level – $2700
Charts courtesy – Trading View, Kraken


