
Reason to trust
How Our News is Made
Strict editorial policy that focuses on accuracy, relevance, and impartiality
Ad discliamer
Morbi pretium leo et nisl aliquam mollis. Quisque arcu lorem, ultricies quis pellentesque nec, ullamcorper eu odio.
Key Points
- Bitcoin price is recovering and is currently placed nicely above the $15,000 level against the US Dollar.
- There was a break above a key bearish trend line with resistance at $14,100 on the 4-hours chart of BTC/USD (data feed from SimpleFX).
- On the downside, there is a connecting bullish trend line forming with support at $15,800 on the same chart.
Bitcoin price is moving positively from $12,500 low against the US Dollar. BTC/USD is currently eyeing more gains as long as above $15,800.
Bitcoin Price Rise
We saw a decent support base formed in bitcoin price around the $12,000 level against the US Dollar. The price started a nice upside move and managed to move above the $13,000 and $14,000 resistance levels. During the upside move, the price also moved above the $15,000 level and the 100 simple moving average (4-hours). Moreover, there was a break above a key bearish trend line with resistance at $14,100 on the 4-hours chart of BTC/USD.
It opened the gates for more gains and the price was able to move above the $15,000 and $16,000 levels. A high was formed recently at $17,048 from where the price may correct a few points lower. An initial support on the downside is around the 38.2% Fib retracement level of the last wave from the $14,040 low to $17,048 high. Moreover, there is a connecting bullish trend line forming with support at $15,800 on the same chart.
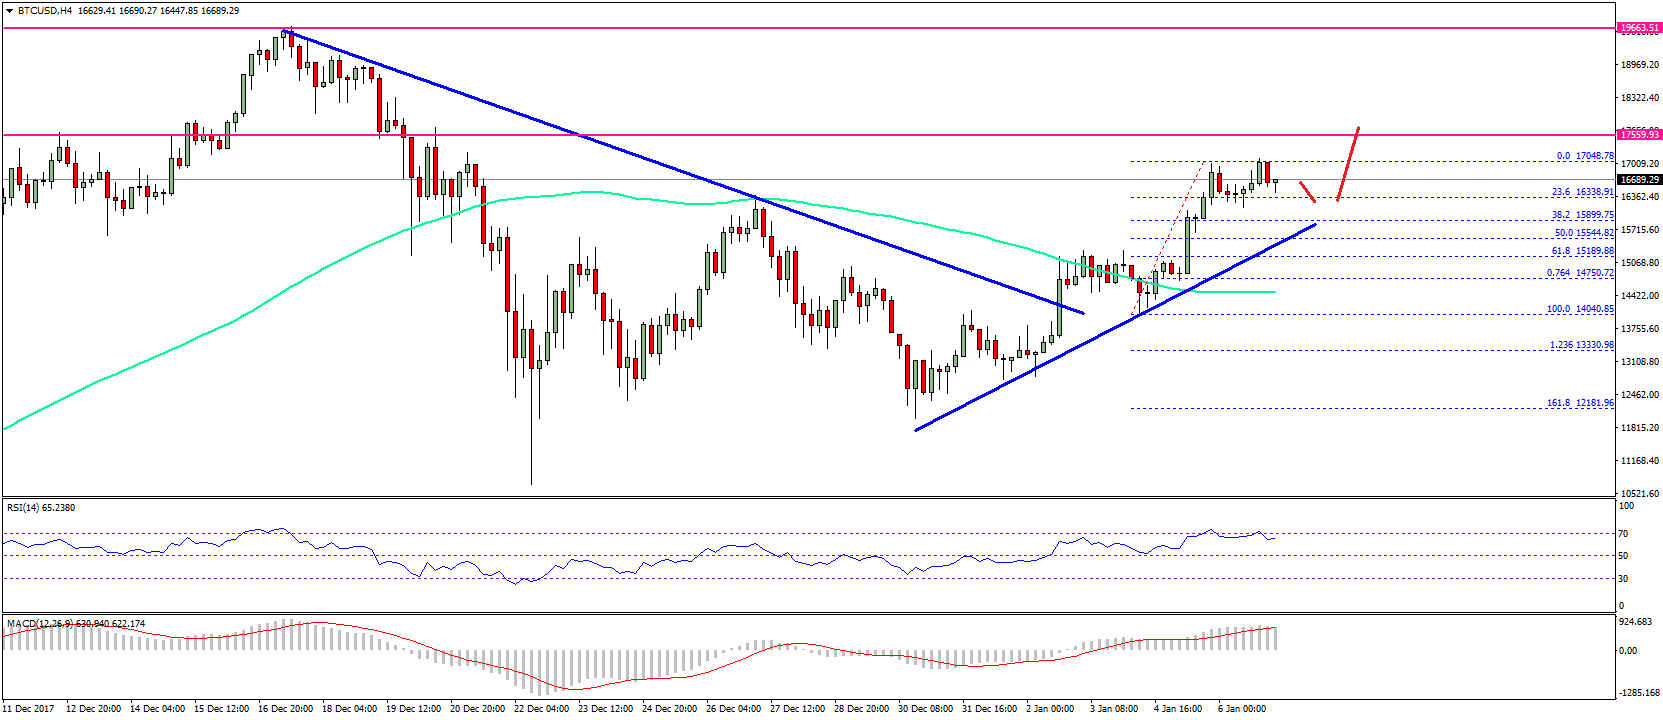
The trend line support is near the 50% Fib retracement level of the last wave from the $14,040 low to $17,048 high. Therefore, if the price corrects lower, it is likely to find support above $15,500. The overall trend is positive for BTC and the price is likely to move further higher above $17,000.
Looking at the technical indicators:
4-hours MACD – The MACD is placed nicely in the bearish slope.
4-hours RSI (Relative Strength Index) – The RSI is moving lower towards the 55 level.
Major Support Level – $15,800
Major Resistance Level – $17,000
Charts courtesy – SimpleFX


dd71003716172adf509859da2191d6c54226f355b86b4327c3733d6b9fe076ed
bullish before coinmarketcap fiasco. the fuckers should be prosecuted for blatant price manipulation