Reason to trust
How Our News is Made
Strict editorial policy that focuses on accuracy, relevance, and impartiality
Ad discliamer
Morbi pretium leo et nisl aliquam mollis. Quisque arcu lorem, ultricies quis pellentesque nec, ullamcorper eu odio.
Key Highlights
- ETH price is grinding higher and it recently moved above the $1150 resistance against the US Dollar.
- There is a key bullish trend line forming with support at $1145 on the hourly chart of ETH/USD (data feed via SimpleFX).
- The pair remains supported on the downside above $1120, and it may continue to rise in the near term.
Ethereum price is back in the bullish zone against the US Dollar and Bitcoin. ETH/USD is likely to extend gains above the $1200 and $1250 level.
Ethereum Price Support
There was a start of a fresh upside wave in ETH price above the $1120 level against the US Dollar. The price gained pace and was able to move above the $1150 and $1200 resistance levels. It even traded above the $1220 level and formed a high at $1229. Later, a downside correction was initiated and the price moved below the 23.6% Fib retracement level of the last wave from the $1078 low to $1229 high.
On the downside, there is a key bullish trend line forming with support at $1145 on the hourly chart of ETH/USD. At the moment, the pair is testing the 50% Fib retracement level of the last wave from the $1078 low to $1229 high. It is finding bids near the $1155-60 support area. It seems like the current price action is bullish above the $1120 level. The trend line support at $1145 may be considered as a major buy zone in the short term. As long as the pair is above the $1120 pivot level, it remains in an uptrend.
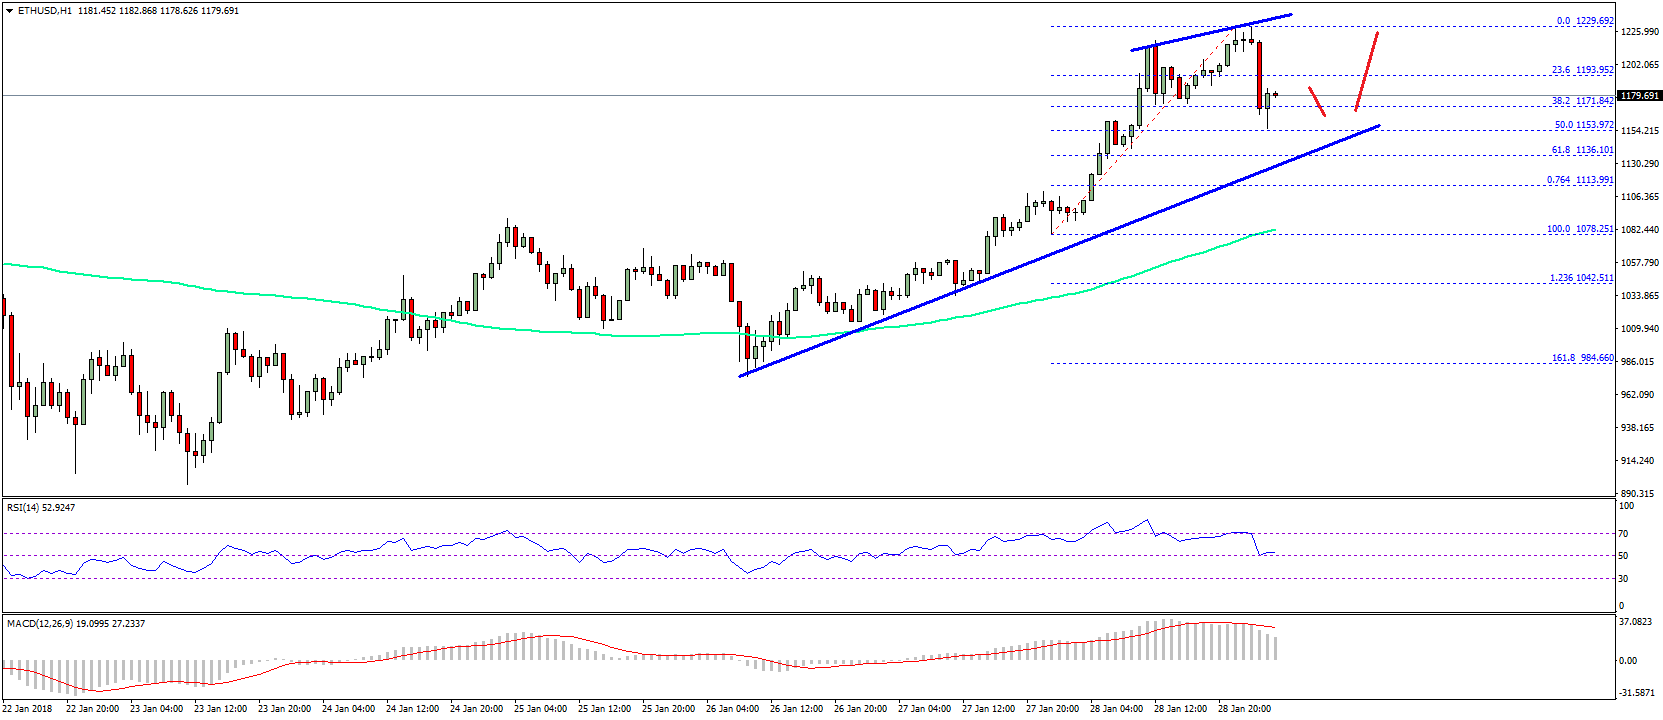
On the upside, an initial resistance is near the $1200 level. A break above $1200 could push the price towards $1225-30 in the near term.
Hourly MACD – The MACD is back in the bullish zone.
Hourly RSI – The RSI is currently around the 50 level and is showing positive signs.
Major Support Level – $1120
Major Resistance Level – $1200
Charts courtesy – SimpleFX