
Reason to trust
How Our News is Made
Strict editorial policy that focuses on accuracy, relevance, and impartiality
Ad discliamer
Morbi pretium leo et nisl aliquam mollis. Quisque arcu lorem, ultricies quis pellentesque nec, ullamcorper eu odio.
Key Highlights
- ETH price is correcting lower, but it is holding the $900 support area against the US Dollar.
- There is a short-term bearish trend line forming with resistance at $920 on the hourly chart of ETH/USD (data feed via SimpleFX).
- The pair is now below the 100 hourly simple moving average and $950, which are likely to act as resistances.
Ethereum price is moving lower further against the US Dollar and Bitcoin. ETH/USD has to hold the $900 support level to remain in a bullish trend.
Ethereum Price Support
There was a nice upside move above $940 this past week in ETH price against the US Dollar. The price traded above the $950 level, but it could not test the $1,000 level. A high was formed at $970 from where a downside correction was initiated. It moved down and broke the 38.2% Fib retracement level of the last wave from the $868 low to $970 high.
There was also a break below the $925 support and the 100 hourly simple moving average. However, the downside move was protected by the $900 support. A low was formed at $895 and the price started an upside correction. It traded above the 23.6% Fib retracement level of the last decline from the $970 high to $895 low. However, the price failed to gain upside momentum above the $930 level and the 100 hourly SMA. It failed to break the 50% Fib retracement level of the last decline from the $970 high to $895 low.
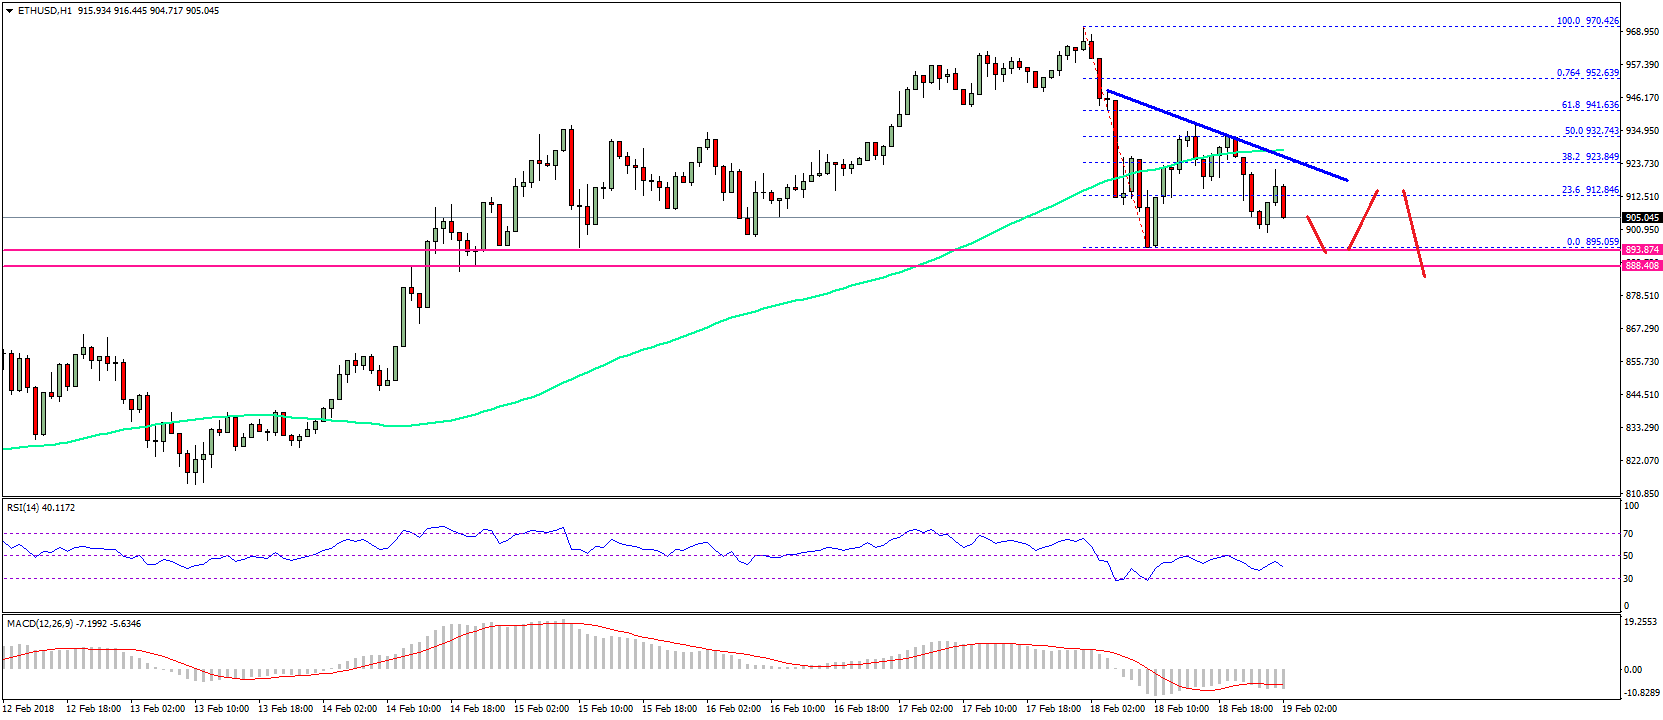
On the upside, there is a short-term bearish trend line forming with resistance at $920 on the hourly chart of ETH/USD. As long as the pair is below the trend line, $930 and 100 hourly SMA, it could continue to struggle.
Hourly MACD – The MACD has moved into the bearish zone.
Hourly RSI – The RSI is now well below the 50 level and is showing bearish signs.
Major Support Level – $900
Major Resistance Level – $930
Charts courtesy – SimpleFX


