
Reason to trust
How Our News is Made
Strict editorial policy that focuses on accuracy, relevance, and impartiality
Ad discliamer
Morbi pretium leo et nisl aliquam mollis. Quisque arcu lorem, ultricies quis pellentesque nec, ullamcorper eu odio.
Key Points
- Bitcoin cash price started a decent upside move and traded above the $1,200 resistance against the US Dollar.
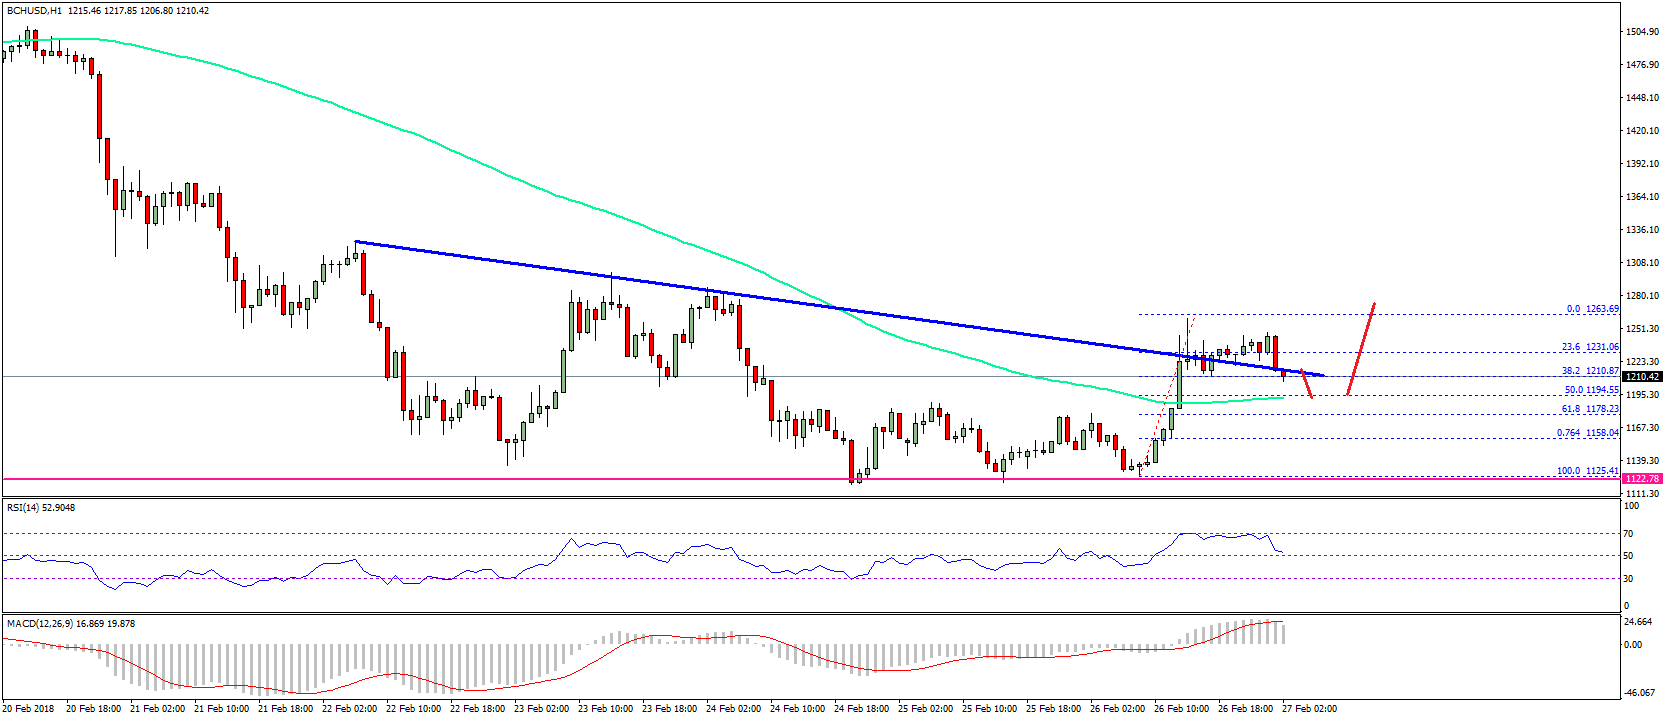
- There was a partial break above yesterday’s highlighted bearish trend line with resistance at $1,220 on the hourly chart of BCH/USD (data feed from SimpleFX).
- The pair is correcting lower, but it is above the $1,200 level and the 100 hourly simple moving average.
Bitcoin cash price made a positive move above $1,200 against the US Dollar. BCH/USD must stay above 100 hourly SMA to gain further upside momentum.
Bitcoin Cash Price Support
Yesterday, we saw how there was a key support forming above the $1,100 level in bitcoin cash price against the US Dollar. The price started a slow and steady rise and it was able to move above the $1,160 resistance. There was also a break above the 61.8% Fib retracement level of the last downside wave from the $1,285 high to $1,116 low. It opened the doors for more gains and the price settled above $1,200 and the 100 hourly simple moving average.
More importantly, there was a partial break above yesterday’s highlighted bearish trend line with resistance at $1,220 on the hourly chart of BCH/USD. The pair traded as high as $1,263 and it is currently correcting lower. It has moved below the 23.6% Fib retracement level of the last wave from the $1,125 low to $1,263 high. It is currently testing the broken trend line at $1,210. On the downside, the 50% Fib retracement level of the last wave from the $1,125 low to $1,263 high is at $1,195 to act as a support. Moreover, the stated $1,195 level is also near the 100 hourly SMA.
Therefore, as long as the price is above $1,190 and the 100 hourly SMA, it could rise once again.
Looking at the technical indicators:
Hourly MACD – The MACD for BCH/USD is now back in the bullish zone.
Hourly RSI (Relative Strength Index) – The RSI for BCH/USD is moving lower towards the 50 level.
Major Support Level – $1,190
Major Resistance Level – $1,250
Charts courtesy – SimpleFX


