
Reason to trust
How Our News is Made
Strict editorial policy that focuses on accuracy, relevance, and impartiality
Ad discliamer
Morbi pretium leo et nisl aliquam mollis. Quisque arcu lorem, ultricies quis pellentesque nec, ullamcorper eu odio.
Key Points
- Bitcoin cash price failed to hold the $950 support level and declined below $900 against the US Dollar.
- There are two key bearish trend lines forming with resistances at $940 and $960 on the hourly chart of the BCH/USD pair (data feed from Kraken).
- The pair is under a lot of pressure and it is likely to break the $880 support as well.
Bitcoin cash price is trading lower towards $850 against the US Dollar. BCH/USD is now well below the $950 level and it remains at a risk of more losses.
Bitcoin Cash Price Decline
There was an increase in selling pressure as bitcoin cash price failed to hold the $950 support against the US Dollar. The mentioned $950 support was significant and a break below the same has the path for more losses. The price even broke the $920 and $900 levels to trade as low as $881 recently. Later, there was a minor upside correction and the price moved above the 23.6% Fib retracement level of the last drop from the $990 high to $881 low.
However, the upside move was capped by the $920 level. Moreover, the 38.2% Fib retracement level of the last drop from the $990 high to $881 low also prevented gains. BCH is once again declining and is currently flirting with the $900 level. To the topside, there are two key bearish trend lines forming with resistances at $940 and $960 on the hourly chart of the BCH/USD pair. The first trend line is also close to the 50% Fib retracement level of the last drop from the $990 high to $881 low.
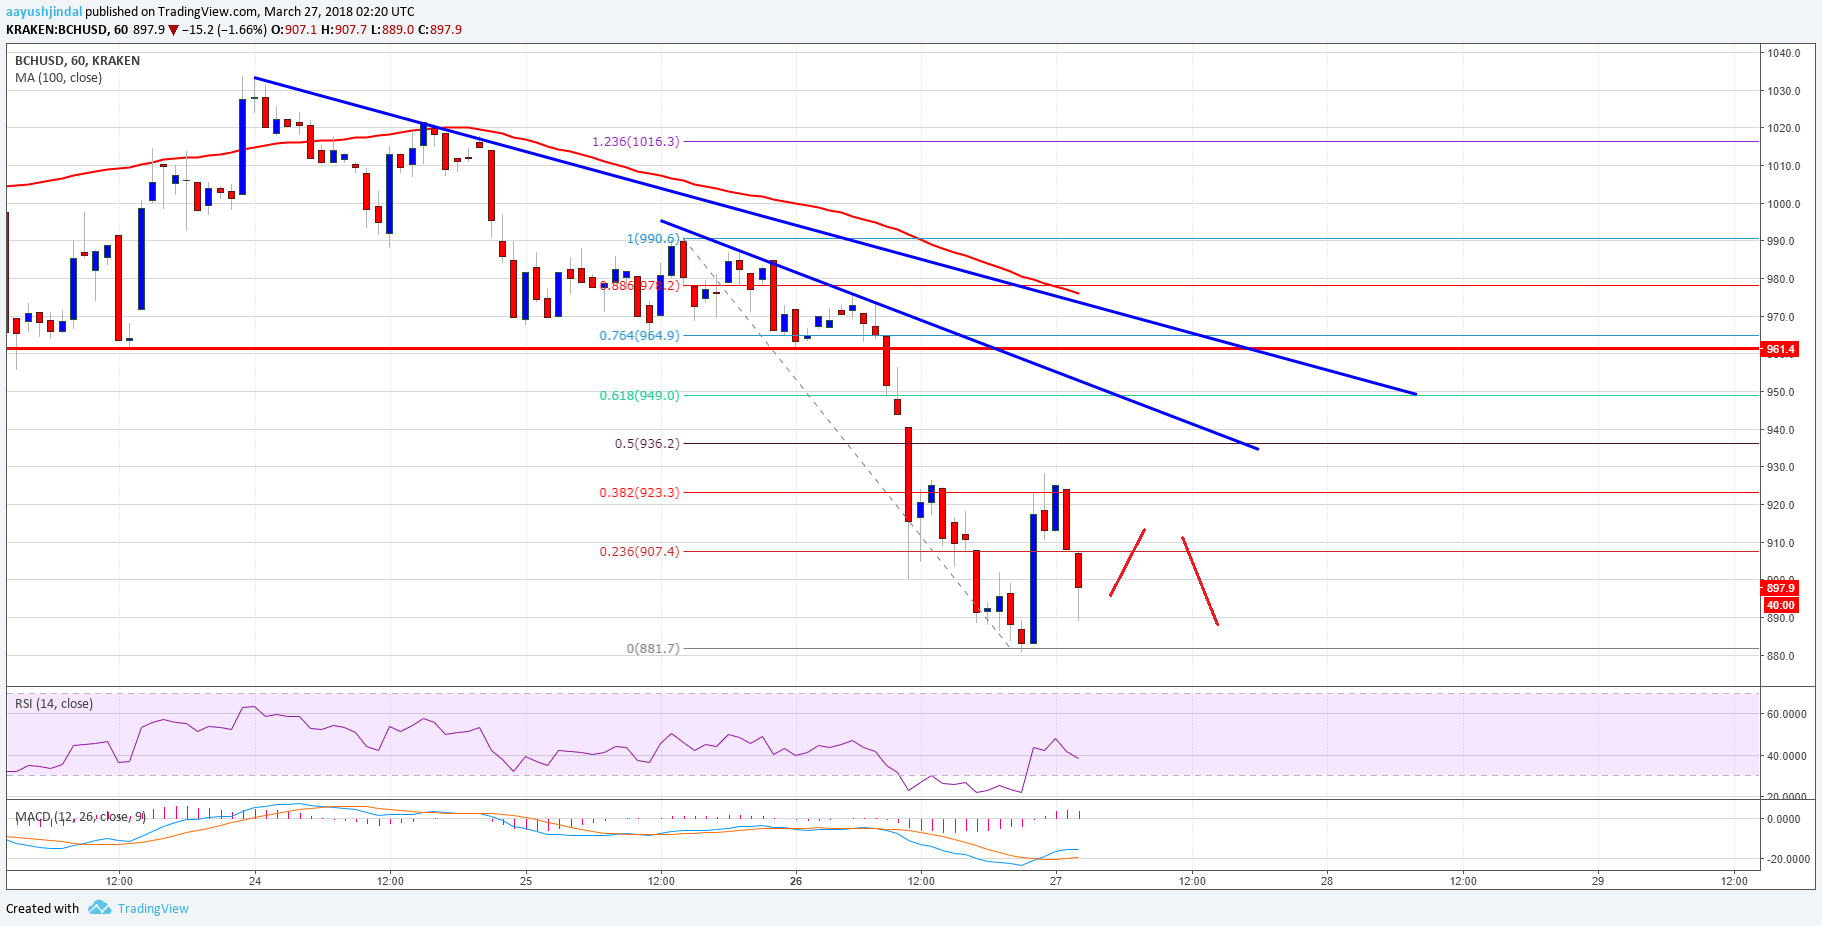
Therefore, if the price corrects higher, it will most likely face sellers near $940-950. On the downside, the price may even break the $880 low for a test of $850.
Looking at the technical indicators:
Hourly MACD – The MACD for BCH/USD is slightly in the bullish zone.
Hourly RSI (Relative Strength Index) – The RSI for BCH/USD is moving lower towards the 30 level.
Major Support Level – $880
Major Resistance Level – $940
Charts courtesy – Trading View


