
Reason to trust
How Our News is Made
Strict editorial policy that focuses on accuracy, relevance, and impartiality
Ad discliamer
Morbi pretium leo et nisl aliquam mollis. Quisque arcu lorem, ultricies quis pellentesque nec, ullamcorper eu odio.
Key Points
- Bitcoin cash price failed to move above the $900 resistance zone and declined against the US Dollar.
- There is a short-term connecting bullish trend line formed with support at $865 on the hourly chart of the BCH/USD pair (data feed from Kraken).
- The pair must stay above $860 and the 100 hourly simple moving average to avoid more losses.
Bitcoin cash price failed to surpass a major hurdle near $900 against the US Dollar. BCH/USD declined and is currently testing the 100 hourly SMA.
Bitcoin Cash Price Resistance
Yesterday, we saw a decent upside move in bitcoin cash price above the $880 level against the US Dollar. The price traded towards the $900-910 resistance zone where sellers appeared. It failed to move above $910 and started a downside move. There was a major bearish reaction and the price declined below the $880 level. Moreover, there was also a break below the 50% Fib retracement level of the last wave from the $826 low to $927 high.
At the moment, the price is approaching a key support area above $860. There is also a short-term connecting bullish trend line formed with support at $865 on the hourly chart of the BCH/USD pair. The same trend line is positioned around the 61.8% Fib retracement level of the last wave from the $826 low to $927 high. Moreover, the 100 hourly simple moving average is positioned around the $860 level. Therefore, the $860-865 support zone holds a lot of importance.
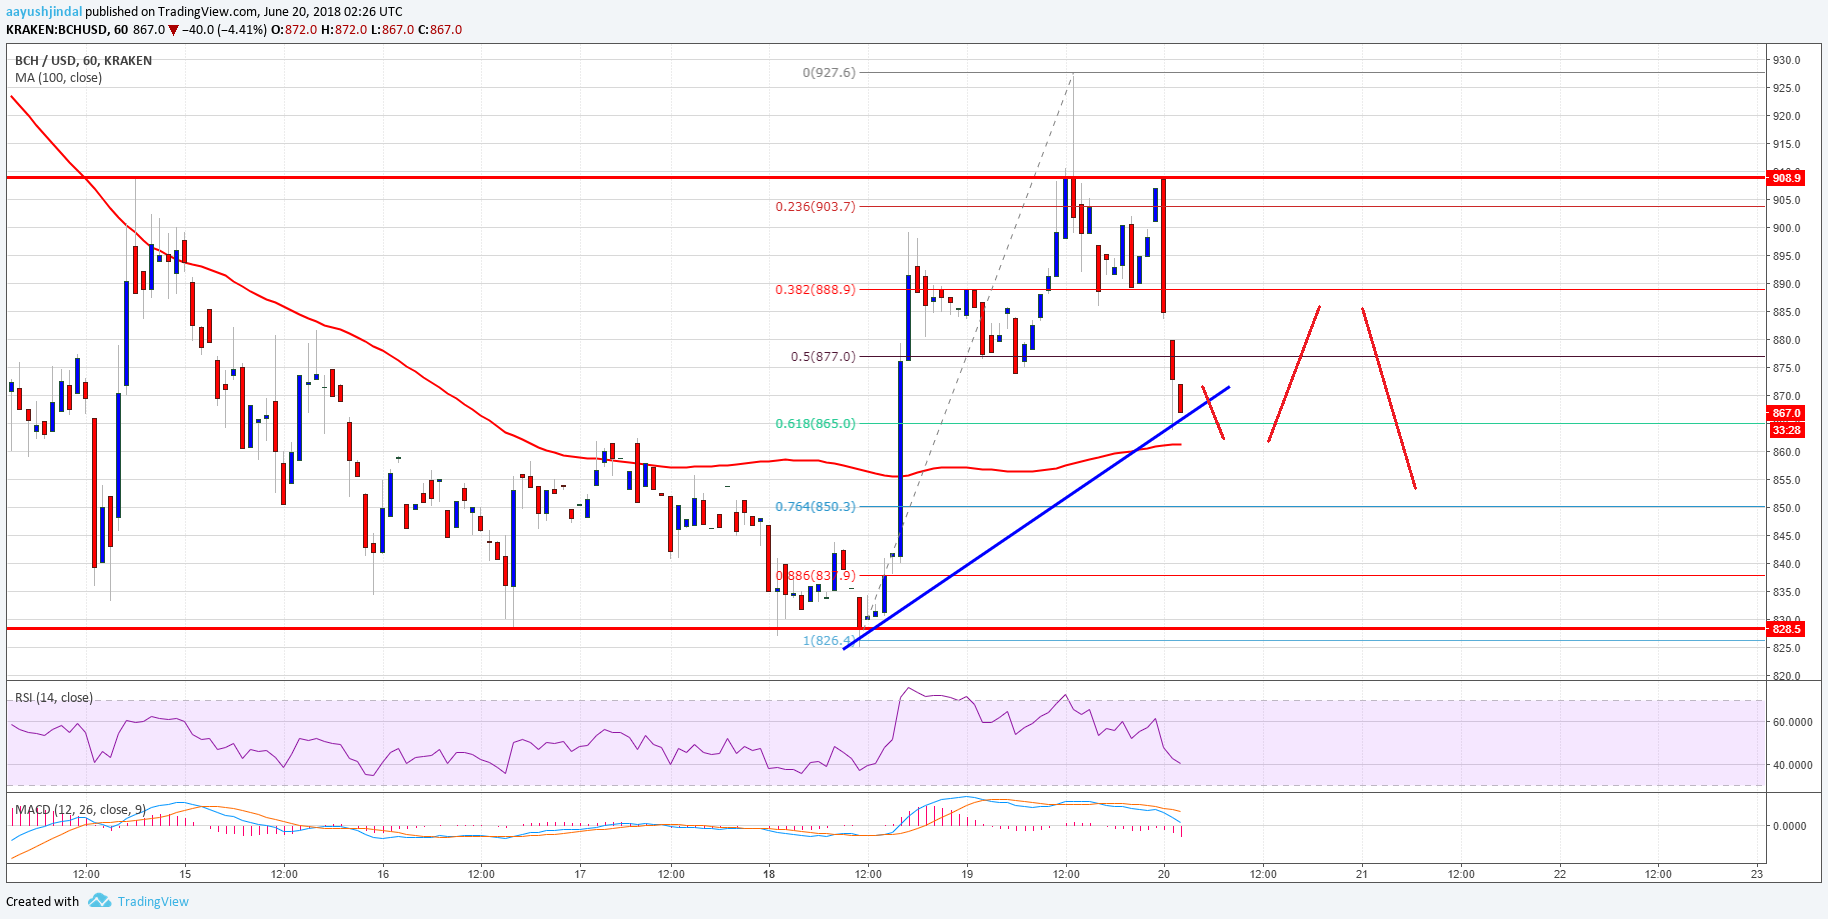
Looking at the chart, the pair must stay above $860 and the 100 hourly simple moving average. If not, there are chances of more declines below the $850 level in the near term. On the upside, resistances are seen near $880 and $900 levels.
Looking at the technical indicators:
Hourly MACD – The MACD for BCH/USD is now back in the bearish zone.
Hourly RSI (Relative Strength Index) – The RSI for BCH/USD dipped sharply below the 50 level.
Major Support Level – $860
Major Resistance Level – $900


