
Reason to trust
How Our News is Made
Strict editorial policy that focuses on accuracy, relevance, and impartiality
Ad discliamer
Morbi pretium leo et nisl aliquam mollis. Quisque arcu lorem, ultricies quis pellentesque nec, ullamcorper eu odio.
Key Points
- Bitcoin cash price found support above the $500 level and started an upward move against the US Dollar.
- Yesterday’s highlighted connecting bearish trend line with resistance at $535 was breached on the hourly chart of the BCH/USD pair (data feed from Kraken).
- The pair is likely to continue higher towards the $560 and $570 levels in the near term.
Bitcoin cash price is placed nicely above the $520 support against the US Dollar. BCH/USD may accelerate towards the $560-570 resistance zone if buyers gain momentum.
Bitcoin Cash Price Analysis
Yesterday, we discussed a consolidation pattern above the $500 support in bitcoin cash price against the US Dollar. The BCH/USD pair formed a decent support above the $500 and $510 levels. Later, the price gained traction and moved above the $525 resistance and the 100 hourly simple moving average. Buyers were successful in clearing the 23.6% Fib retracement level of the downside move from the $590 swing high to $510 swing low.
Additionally, yesterday’s highlighted connecting bearish trend line with resistance at $535 was breached on the hourly chart of the BCH/USD pair. The pair is currently placed nicely above the $530 level and the 100 hourly SMA. The next resistance awaits near $550 and the 50% Fib retracement level of the downside move from the $590 swing high to $510 swing low. Above $550, the next immediate barrier is at $560, which is the 61.8% Fib level. The final target for buyers could the $570 resistance and the pivot level.
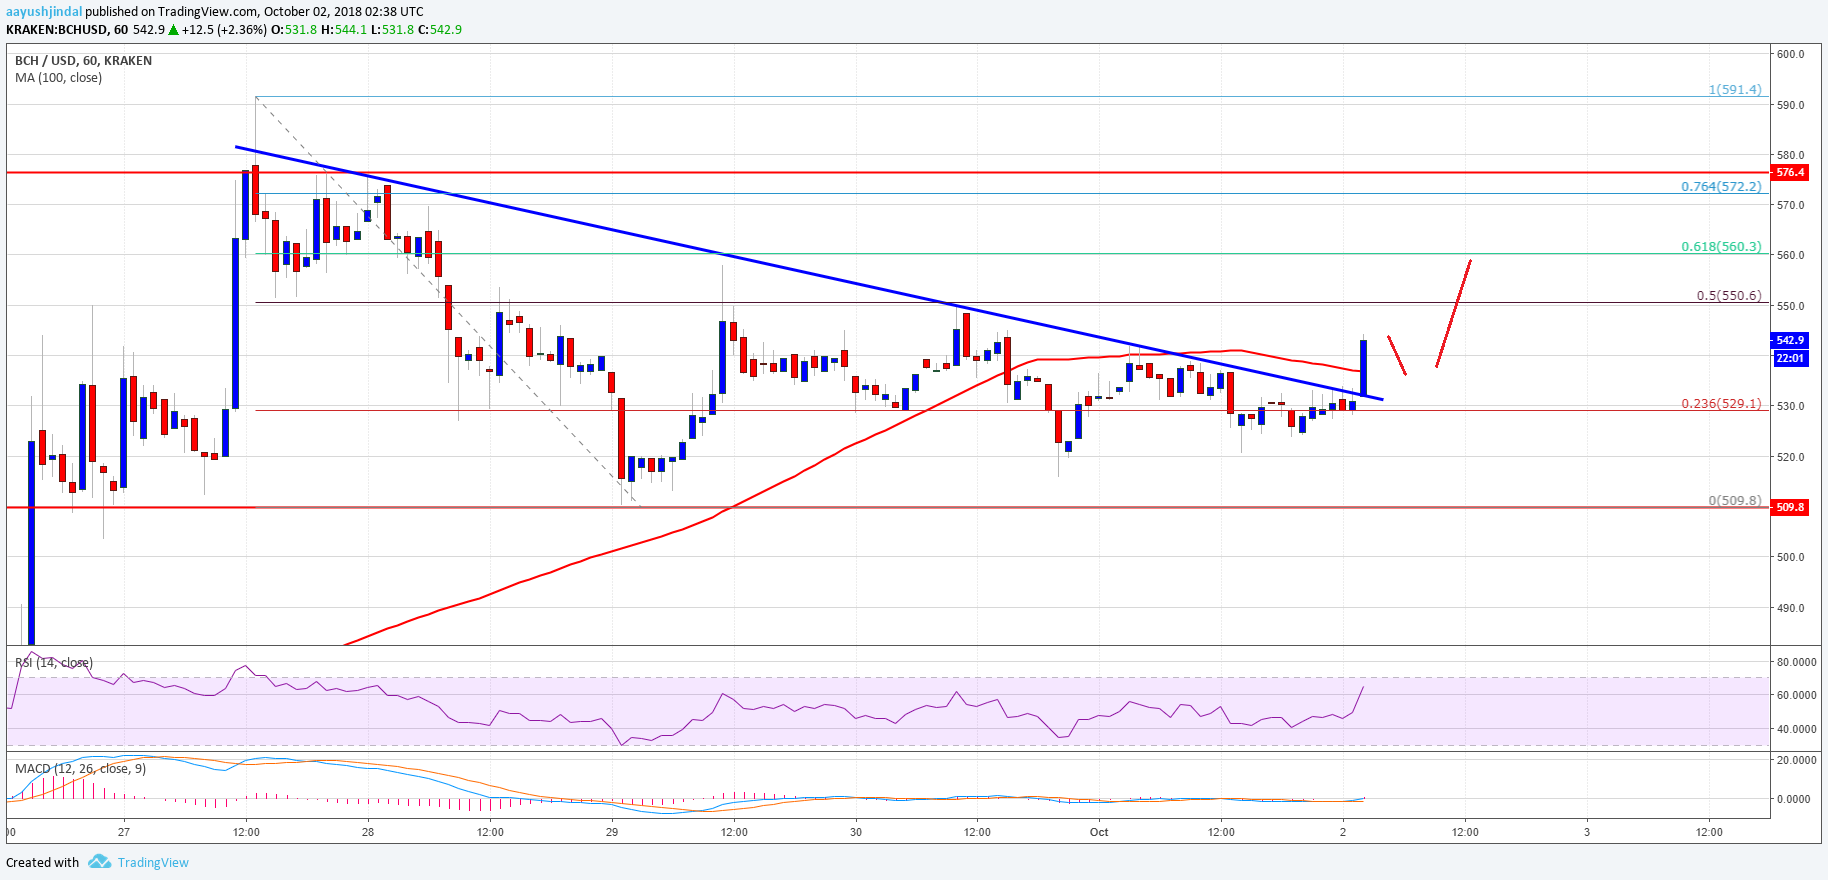
Looking at the chart, BCH price is gaining traction after forming the $510 support. As long as the price is above the $520 level, there could be more gains towards the $560 and $570 levels in the near term.
Looking at the technical indicators:
Hourly MACD – The MACD for BCH/USD is gaining momentum in the bullish zone.
Hourly RSI (Relative Strength Index) – The RSI for BCH/USD is now well above the 60 level.
Major Support Level – $520
Major Resistance Level – $560


