
Reason to trust
How Our News is Made
Strict editorial policy that focuses on accuracy, relevance, and impartiality
Ad discliamer
Morbi pretium leo et nisl aliquam mollis. Quisque arcu lorem, ultricies quis pellentesque nec, ullamcorper eu odio.
Key Points
- Bitcoin cash price failed to break the $530 resistance and declined against the US Dollar.
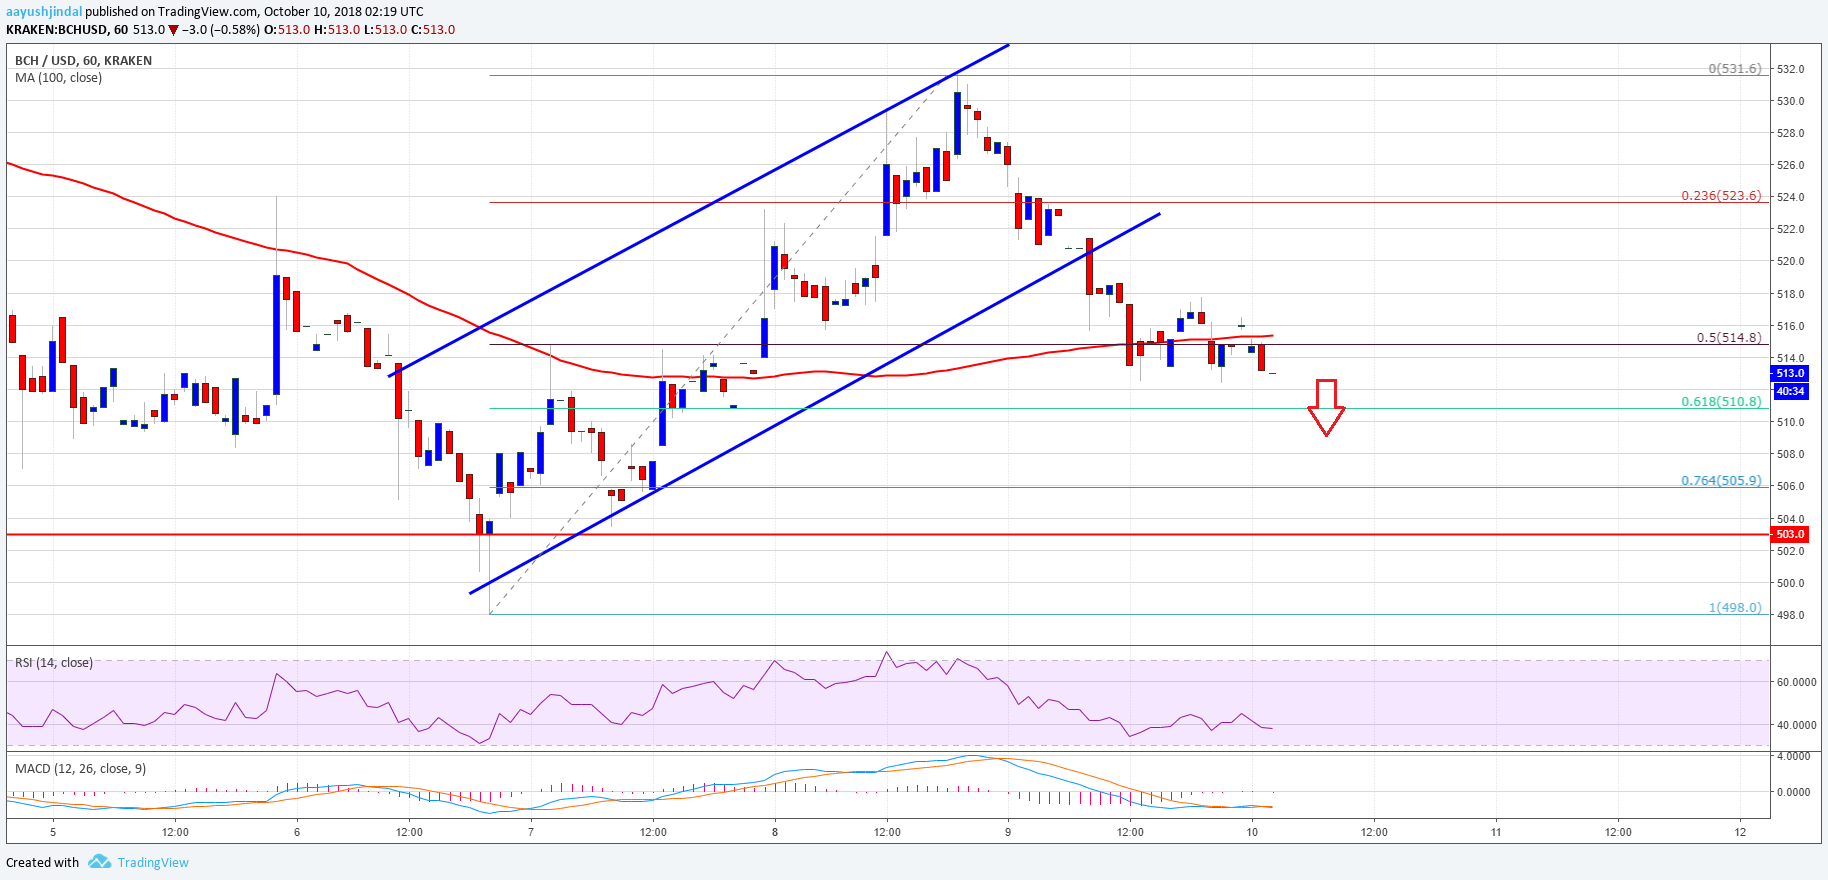
- Yesterday’s highlighted ascending channel was breached with support at $521 on the hourly chart of the BCH/USD pair (data feed from Kraken).
- The pair is currently below the $520 support and it could decline further in the near term.
Bitcoin cash price struggled to break the $530 and $540 hurdles against the US Dollar. BCH/USD is likely to retest the $500 support if sellers remain in action.
Bitcoin Cash Price Analysis
Yesterday, we discussed a possible upside break above the $530 resistance in bitcoin cash price against the US Dollar. However, the BCH/USD pair failed to clear the $530 resistance level and started a fresh decline. During the downside, it broke the $525 support level. It also cleared the 50% Fib retracement level of the last wave from the $500 swing low to $530 high.
Moreover, yesterday’s highlighted ascending channel was breached with support at $521 on the hourly chart of the BCH/USD pair. The pair is currently trading below the $520 support and the 100 hourly simple moving average. An immediate support is near the $510 level. It represents the 61.8% Fib retracement level of the last wave from the $500 swing low to $530 high. Below the $510 support, the price is likely to accelerate declines towards the $505 and $500 support levels. On the other hand, if there is an upside move, the price may struggle near the $520 level. Above this, the $530 resistance could be retested.
Looking at the chart, BCH price seems to be forming a broad range above the $500 support. It could continue to move inside a range before breaking to the upside above $530.
Looking at the technical indicators:
Hourly MACD – The MACD for BCH/USD is about to move into the bullish zone.
Hourly RSI (Relative Strength Index) – The RSI for BCH/USD is now well below the 50 level.
Major Support Level – $500
Major Resistance Level – $530


