
Reason to trust
How Our News is Made
Strict editorial policy that focuses on accuracy, relevance, and impartiality
Ad discliamer
Morbi pretium leo et nisl aliquam mollis. Quisque arcu lorem, ultricies quis pellentesque nec, ullamcorper eu odio.
Key Points
- Bitcoin price failed to trade higher towards $6,800 and declined recently against the US Dollar.
- Yesterday’s highlighted key bullish trend line was breached with support at $6,560 on the hourly chart of the BTC/USD pair (data feed from Kraken).
- The pair declined below the $6,500 support and tested the $6,440 support level.
Bitcoin price trimmed most of its gains against the US Dollar. BTC/USD could recover, but the broken support at $6,560 might act as a resistance.
Bitcoin Price Analysis
Yesterday, we discussed that bitcoin price could climb higher towards the $6,800 level against the US Dollar. However, the BTC/USD pair failed to break the $6,640 and $6,700 resistance levels. It resulted in a downside move below the $6,550 support and the 100 hourly simple moving average. The price moved into a bearish zone as it cleared the important $6,500 support as well.
During the decline, yesterday’s highlighted key bullish trend line was breached with support at $6,560 on the hourly chart of the BTC/USD pair The pair even broke the last swing low at $6,490. Finally, it tested the 1.236 Fib extension level of the last wave from the $6,491 low to $6,687 high. The price formed an intraday low at $6,441 and it is currently correcting higher. An initial resistance is near the 23.6% Fib retracement level of the last decline from the $6,687 high to $6,441 low. If buyers push the price above the $6,500 level, the next stop could be the $6,560 level. The stated $6,560 level along with the 100 hourly SMA are likely to act as hurdles for buyers.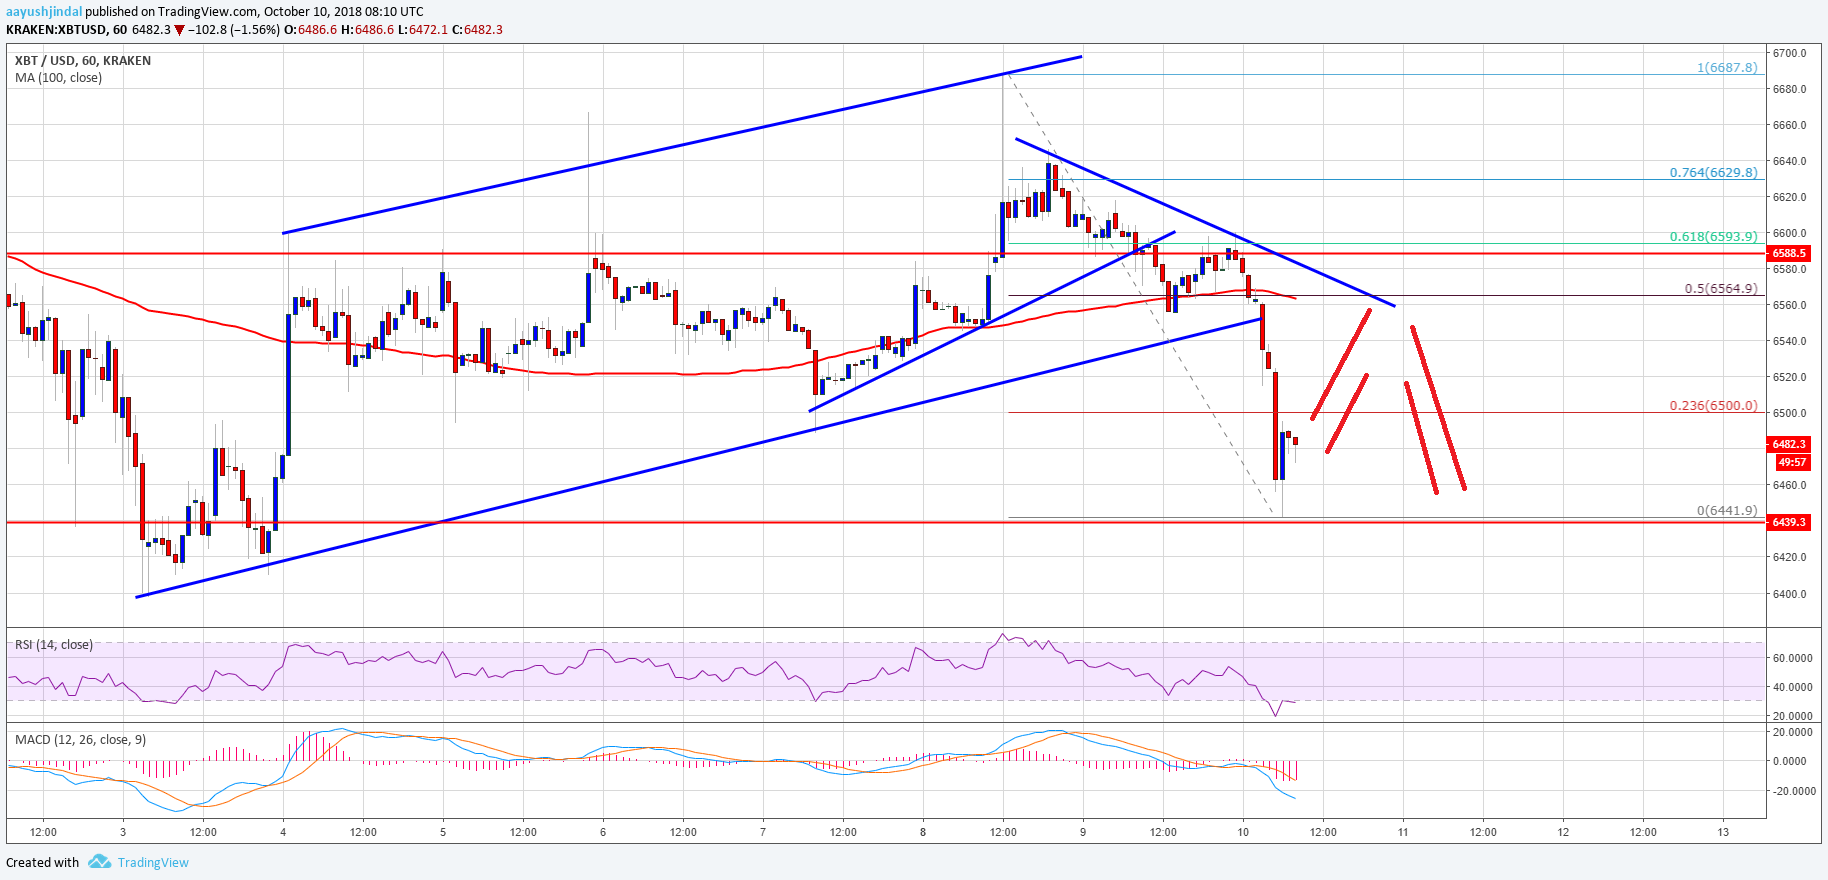
Looking at the chart, bitcoin price broke a few key supports and tested $6,440. It may bounce back, but the previous supports near $6,550-6,560 are likely to prevent an upside break.
Looking at the technical indicators:
Hourly MACD – The MACD for BTC/USD is gaining pace in the bearish zone.
Hourly RSI (Relative Strength Index) – The RSI is currently well below the 40 level.
Major Support Level – $6,440
Major Resistance Level – $6,560


