
Reason to trust
How Our News is Made
Strict editorial policy that focuses on accuracy, relevance, and impartiality
Ad discliamer
Morbi pretium leo et nisl aliquam mollis. Quisque arcu lorem, ultricies quis pellentesque nec, ullamcorper eu odio.
Key Points
- Bitcoin price found support near the $6,100 level and corrected higher against the US Dollar.
- There is a major bearish trend line in place with resistance at $6,325 on the 4-hours chart of the BTC/USD pair (data feed from Kraken).
- The pair must break the $6,325 and $6,390 resistance levels to move into a positive zone.
Bitcoin price is currently correcting higher against the US Dollar. BTC/USD is likely to face a strong selling interest near the $6,380-6,390 resistance area.
Bitcoin Price Analysis
This past week, bitcoin price saw a solid increase in selling pressure around the $6,600 zone against the US Dollar. As a result, there was a nasty decline and the BTC/USD pair fell below the $6,400 and $6,200 support levels. The price traded towards the $6,100 level and formed a low at $6,093. Later, the price started an upside correction and moved above the $6,200 resistance.
There was a break above the 23.6% Fib retracement level of the last slide from the $6,686 high to $6,093 low. At the outset, it is following an ascending channel with resistance at $6,320. Above this, there is a major bearish trend line in place with resistance at $6,325 on the 4-hours chart of the BTC/USD pair. Finally, the $6,380-6,390 is a crucial resistance zone (the previous support). It also represents the 50% Fib retracement level of the last slide from the $6,686 high to $6,093 low. Therefore, if the price continues to move higher, bitcoin buyers are likely to struggle near the $6,380-6,390 zone.
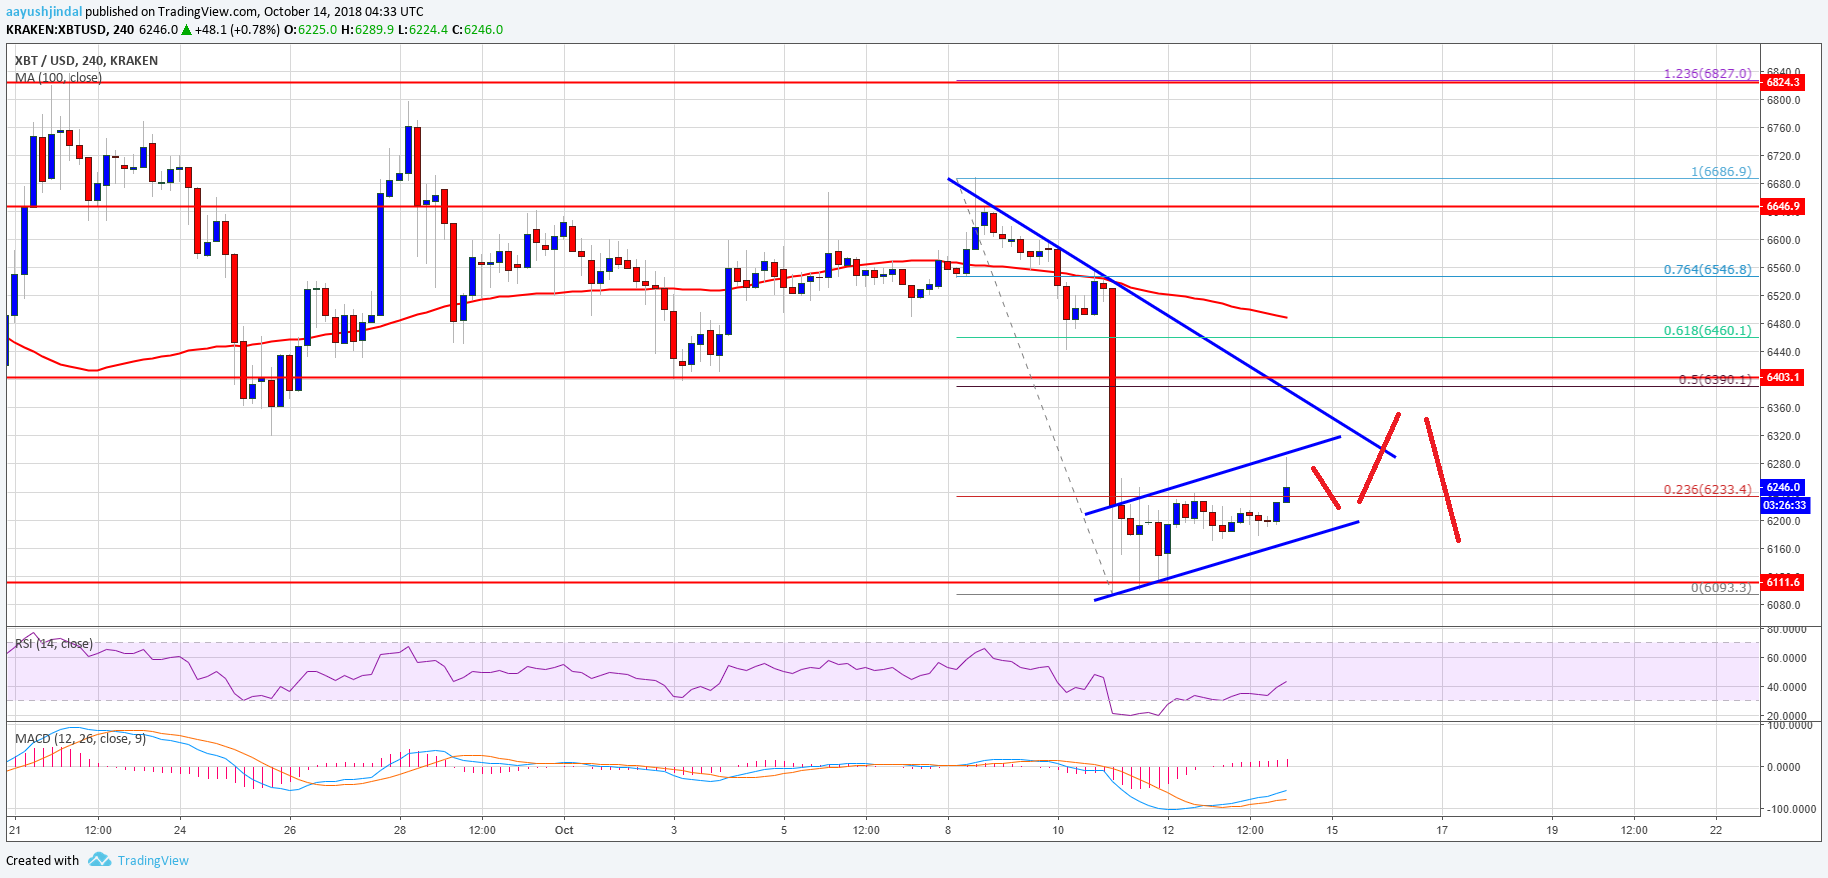
Looking at the chart, BTC price needs to settle above $6,380-6,390 and then $6,400 to move into a positive zone. If it fails, there could be a fresh downside move back towards the $6,200 and $6,100 supports. Below these supports, the price could be at a risk of a bearish break below the $6,000 handle.
Looking at the technical indicators:
4-hours MACD – The MACD for BTC/USD is slowly moving in the bullish zone.
4-hours RSI (Relative Strength Index) – The RSI is currently just above the 40 level.
Major Support Level – $6,100
Major Resistance Level – $6,390


