Reason to trust
How Our News is Made
Strict editorial policy that focuses on accuracy, relevance, and impartiality
Ad discliamer
Morbi pretium leo et nisl aliquam mollis. Quisque arcu lorem, ultricies quis pellentesque nec, ullamcorper eu odio.
Key Points
- Bitcoin cash price started a major downside correction from the $635 swing high against the US Dollar.
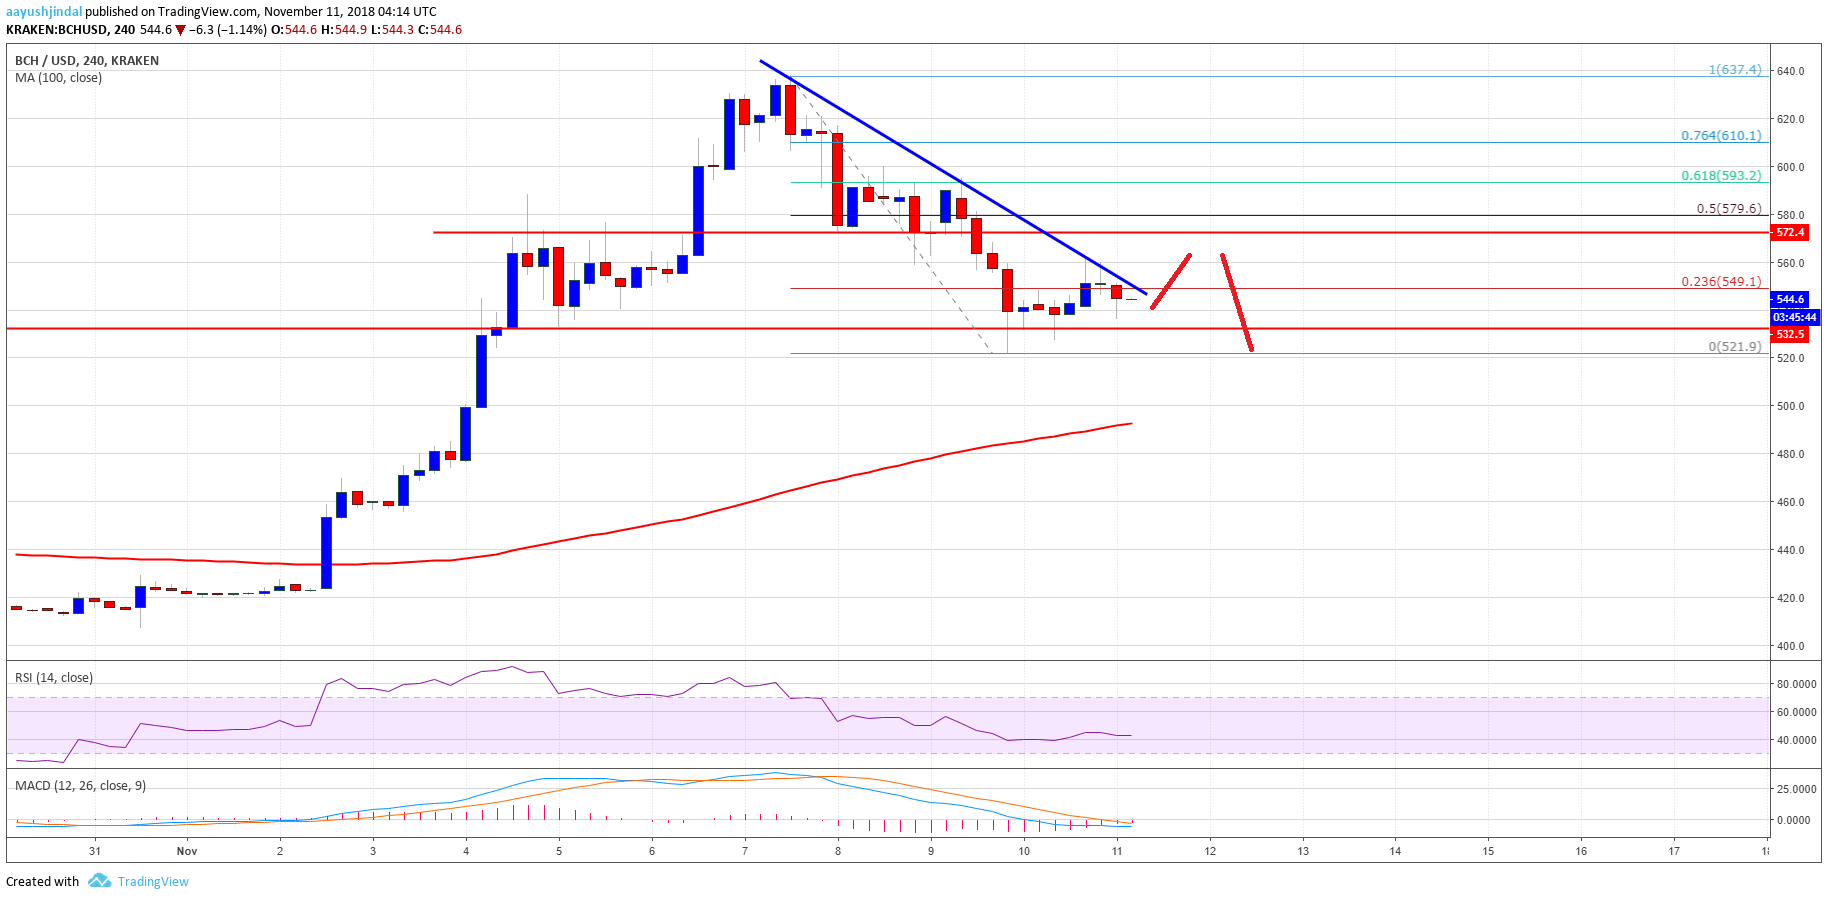
- There is a key bearish trend line in place with resistance at $550 on the 4-hours chart of the BCH/USD pair (data feed from Kraken).
- The pair is currently trading in a bearish zone with an immediate support near the $530 level.
Bitcoin cash price is under pressure below $550 against the US Dollar. BCH/USD could continue to move down towards the $500 or $480 level.
Bitcoin Cash Price Analysis
This past week, there was a decent upward move from the $480 swing low in bitcoin cash price against the US Dollar. The BCH/USD pair traded above the $520 and $550 resistance levels and settled above the 100 simple moving average (4-hours). The upside move gained pace above the $600 and the price traded as high as $637. Later, there was a downside correction and the price moved below the $580 and $550 supports.
The price traded as low as $521 and it is currently consolidating losses. An initial resistance on the upside is near $545-550. The 23.6% Fib retracement level of the recent slide from the $538 swing high to $521 low is also near $550. More importantly, there is a major bearish trend line in place with resistance at $550 on the 4-hours chart of the BCH/USD pair. Therefore, a break above the trend line and $555 is needed for a recovery. However, the price is likely to struggle near the $575-580 resistance zone. Besides, the 50% Fib retracement level of the recent slide from the $538 swing high to $521 low is also near $580.
Looking at the chart, BCH price may surpass the $550 resistance, but it is likely to face a strong resistance near $575-580. Therefore, it could even break the $521 low and decline towards $500 or $480.
Looking at the technical indicators:
4-hours MACD – The MACD for BCH/USD is back in the bearish zone.
4-hours RSI (Relative Strength Index) – The RSI for BTC/USD is currently below the 50 level.
Major Support Level – $520
Major Resistance Level – $580