
Reason to trust
How Our News is Made
Strict editorial policy that focuses on accuracy, relevance, and impartiality
Ad discliamer
Morbi pretium leo et nisl aliquam mollis. Quisque arcu lorem, ultricies quis pellentesque nec, ullamcorper eu odio.
Key Points
- Bitcoin price declined recently below the $6,300 support before correcting higher against the US Dollar.
- There was a break above a connecting bearish trend line with resistance at $6,360 on the hourly chart of the BTC/USD pair (data feed from Kraken).
- The price is struggling to break the $6,380 resistance and the 100 hourly simple moving average.
Bitcoin price is trading in a bearish zone below $6,400 against the US Dollar. BTC/USD could decline further towards the $6,250 or $6,220 level in the near term.
Bitcoin Price Analysis
After trading as high as $6,553, bitcoin price started a major downside correction against the US Dollar. The BTC/USD pair traded below the $6,440 and $6,400 support levels to move into a bearish zone. The price even settled below the $6,400 support and the 100 hourly simple moving average. Sellers managed to push the price towards the $6,250 support before buyers appeared near $6,260.
A low was formed at $6,275 and later the price corrected higher. It moved above the 23.6% Fib retracement level of the last drop from the $6,553 high to $6,257 low. Moreover, there was a break above a connecting bearish trend line with resistance at $6,360 on the hourly chart of the BTC/USD pair. However, the upside move was capped by the $6,380 level and the 100 hourly SMA. It seems like the price may decline once again if there is a break below $6,340 and $6,320. In the mentioned scenario, the price could even trade below the $6,275 low and form a new weekly low.
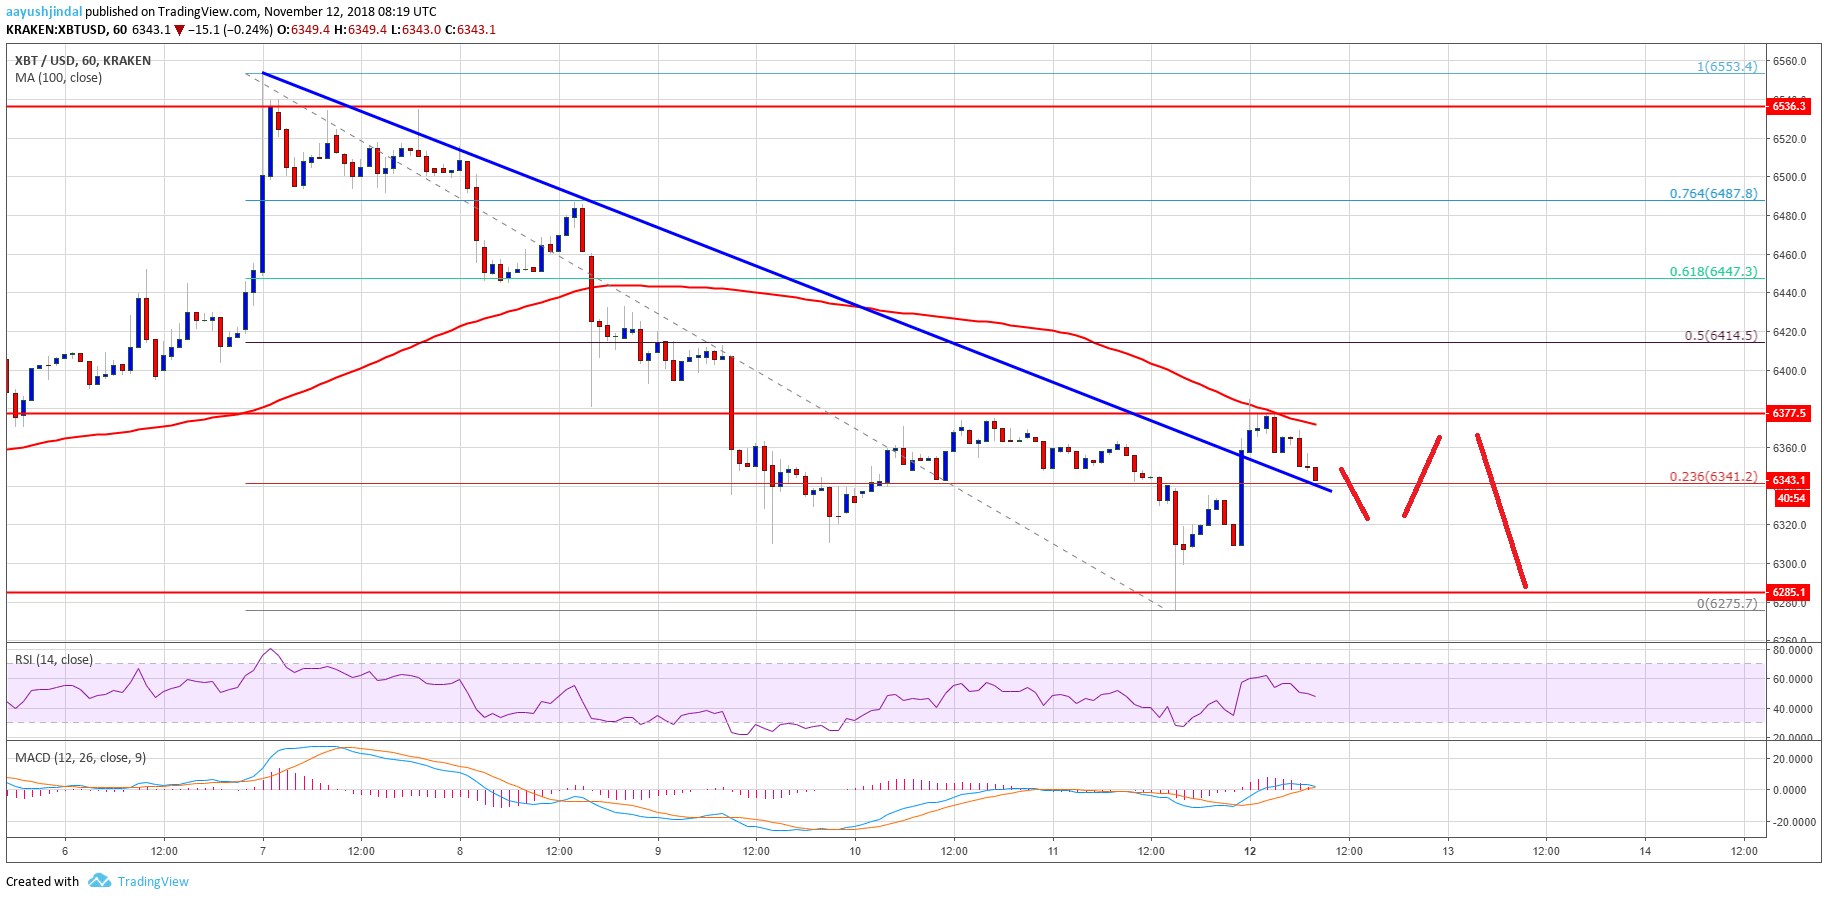
Looking at the chart, bitcoin price needs to move past $6,380 and $6,400 to recover further. The next resistance is near $6,440 and the 61.8% Fib retracement level of the last drop from the $6,553 high to $6,257 low.
Looking at the technical indicators:
Hourly MACD – The MACD for BTC/USD is slowly moving back in the bearish zone.
Hourly RSI (Relative Strength Index) – The RSI just moved below the 50 level.
Major Support Level – $6,375
Major Resistance Level – $6,400


