
Reason to trust
How Our News is Made
Strict editorial policy that focuses on accuracy, relevance, and impartiality
Ad discliamer
Morbi pretium leo et nisl aliquam mollis. Quisque arcu lorem, ultricies quis pellentesque nec, ullamcorper eu odio.
Key Points
- Bitcoin price declined further and traded below the $6,275 support level against the US Dollar.
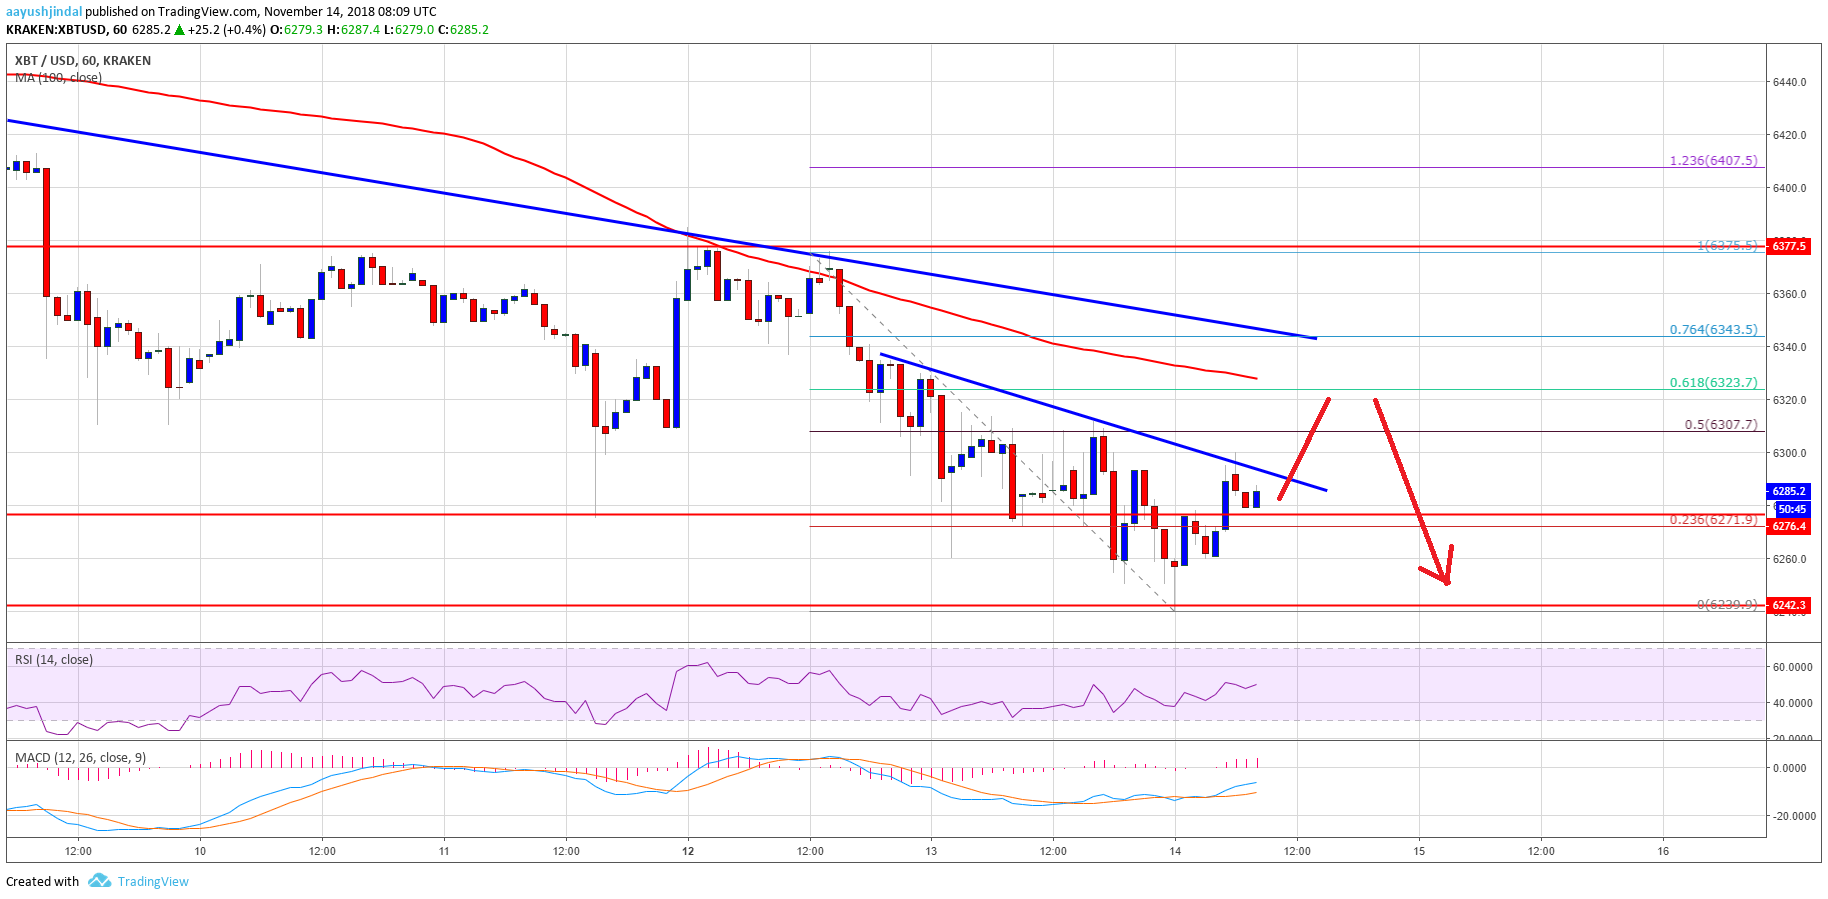
- There are two bearish trend lines formed with resistance at $6,300 and $6,340 on the hourly chart of the BTC/USD pair (data feed from Kraken).
- The price remains at a risk of more losses below the $6,250 support in the near term.
Bitcoin price is placed in a bearish zone against the US Dollar. BTC/USD could recover, but upsides are likely to be capped around the $6,340 level.
Bitcoin Price Analysis
During the past three sessions, there were bearish moves below $6,350 in bitcoin price against the US Dollar. The BTC/USD pair declined recently and broke the $6,300 and $6,275 support levels. There was even a spiked below the $6,250 support and the price formed a new monthly low at $6,239. The price recovered a few points above $6,275, but it is still well below the 100 hourly simple moving average.
An initial barrier for buyers is near the 50% Fib retracement level of the recent drop from the $6,375 high to $6,239 low. More importantly, there are two bearish trend lines formed with resistance at $6,300 and $6,340 on the hourly chart of the BTC/USD pair. Below the second trend line, the 100 hourly SMA is positioned at $6,325. Besides, the 61.8% Fib retracement level of the recent drop from the $6,375 high to $6,239 low is near $6,323. Therefore, if the price corrects higher from the current levels, it is likely to find a strong selling interest near $6,320 and $6,340.
Looking at the chart, bitcoin price is clearly in a bearish zone below the $6,350 pivot level. On the downside, an initial support is near $6,240, below which the price could slide towards the $6,200 support.
Looking at the technical indicators:
Hourly MACD – The MACD for BTC/USD is slightly placed in the bullish zone.
Hourly RSI (Relative Strength Index) – The RSI is currently just near the 50 level.
Major Support Level – $6,340
Major Resistance Level – $6,240


