Reason to trust
How Our News is Made
Strict editorial policy that focuses on accuracy, relevance, and impartiality
Ad discliamer
Morbi pretium leo et nisl aliquam mollis. Quisque arcu lorem, ultricies quis pellentesque nec, ullamcorper eu odio.
Key Points
- Bitcoin cash price failed to break the $195 and $198 resistance levels against the US Dollar.
- There is a crucial contracting triangle forming with resistance near $198 on the hourly chart of the BCH/USD pair (data feed from Kraken).
- The pair is likely to make the next move either above $198 or below $175 in the near term.
Bitcoin cash price is struggling to clear the $200 hurdle against the US Dollar. BCH/USD is approaching the next break either above $198-200 or towards $165.
Bitcoin Cash Price Analysis
There was a slow and steady rise from the $165 swing low in bitcoin cash price against the US Dollar. The BCH/USD pair traded above the $175 and $180 resistance levels to move into a positive zone. There was even a close above the $175 level and the 100 hourly simple moving average. However, the price struggled to clear the $198-200 resistance, which is a major hurdle for buyers.
A high was formed at $197 and later the price corrected lower. It declined below the 23.6% Fib retracement level of the last wave from the $166 low to $197 high. The price is now approaching a strong support near the $178-180 zone. Moreover, there is a crucial contracting triangle forming with resistance near $198 on the hourly chart of the BCH/USD pair. The triangle support is near the 100 hourly SMA at $176. Besides, the 61.8% Fib retracement level of the last wave from the $166 low to $197 high is at $178. Therefore, the $175-178 area could act as a strong support for buyers in the short term.
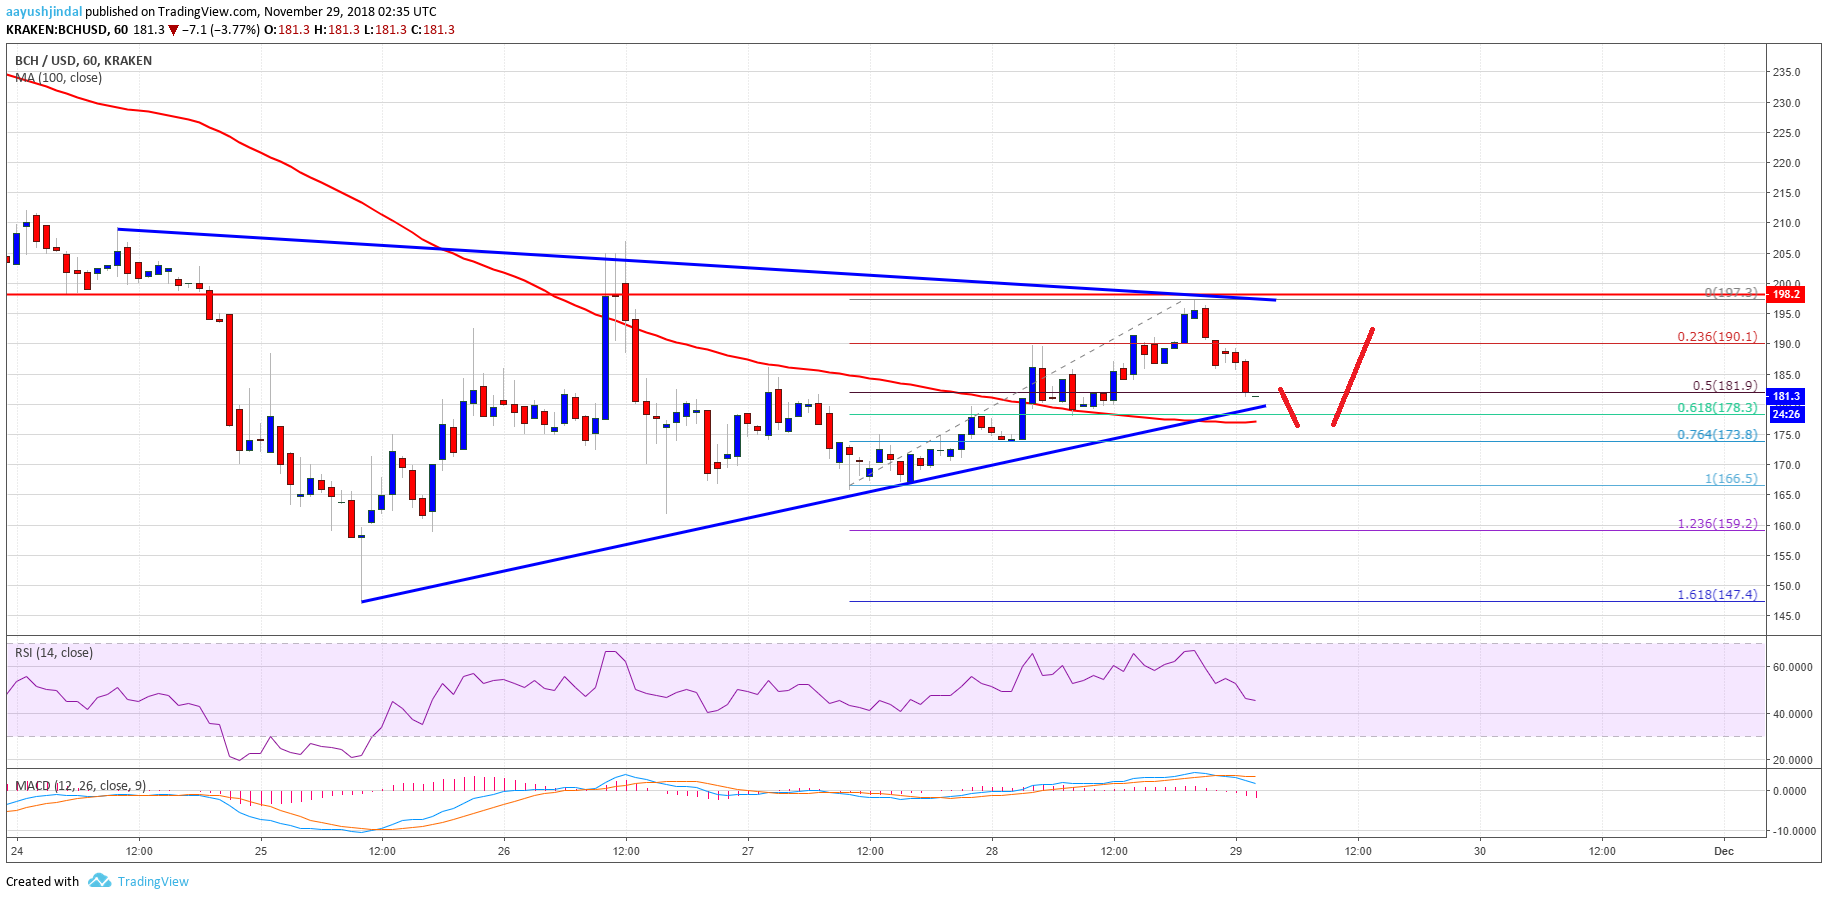
Looking at the chart, BCH price seems to be preparing for the next move either above $198 or below $175. Below $175, the price could revisit $165. And, a break above $200 may spark more gains towards $225.
Looking at the technical indicators:
Hourly MACD – The MACD for BCH/USD has moved back in the bearish zone.
Hourly RSI (Relative Strength Index) – The RSI for BCH/USD also declined below the 50 level.
Major Support Level – $175
Major Resistance Level – $198