
Reason to trust
How Our News is Made
Strict editorial policy that focuses on accuracy, relevance, and impartiality
Ad discliamer
Morbi pretium leo et nisl aliquam mollis. Quisque arcu lorem, ultricies quis pellentesque nec, ullamcorper eu odio.
Key Points
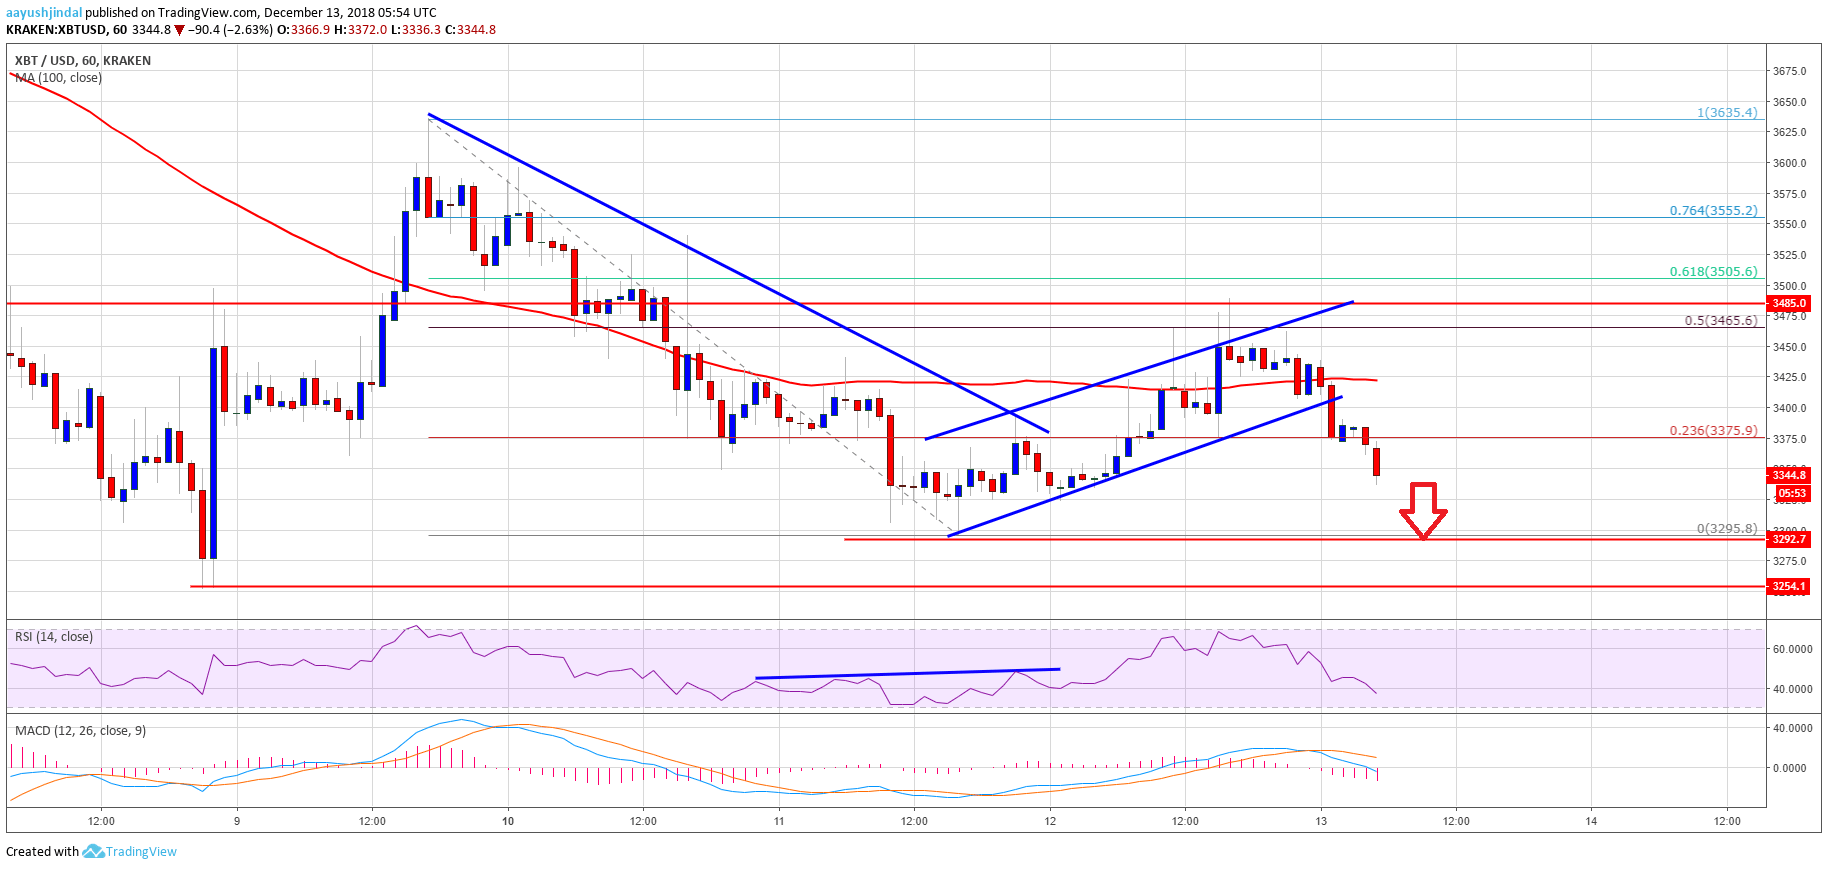
- Bitcoin price failed to break the $3,475 and $3,485 resistance levels and declined against the US Dollar.
- There was a break below an ascending channel with support at $3,405 on the hourly chart of the BTC/USD pair (data feed from Kraken).
- The price may continue to move down towards $3,255 or it could even decline to a new weekly low.
Bitcoin price struggled to gain pace above $3,475 and retreated against the US Dollar. BTC remains at a risk of more declines below the $3,250 support level.
Bitcoin Price Analysis
Recently, bitcoin price started a short term upside correction from the $3,295 low against the US Dollar. The BTC/USD pair traded above the $3,400 resistance and the 100 hourly simple moving average. Besides, there was a break above the 23.6% Fib retracement level of the last decline from the $3,635 high to $3,295 low. The price succeeded in clearing a major bearish trend line with resistance at $3,400 on the hourly chart.
However, buyers struggled to clear the $3,475 and $3,485 resistance levels. A short term top was carved near $3,485. It seems like the price was rejected near the 50% Fib retracement level of the last decline from the $3,635 high to $3,295 low. It broke an ascending channel with support at $3,405 on the same chart. There was also a close below the $3,400 level and the 100 hourly SMA. The current price action suggests that the price may decline towards the $3,295 low or the $3,250 support. If sellers remain in action, the price could decline to a new weekly low below $3,240.
Looking at the chart, bitcoin price may continue to trade in a range below $3,475. It could either bounce back from $3,295 or break the $3,250 support for an extended decline.
Looking at the technical indicators:
Hourly MACD – The MACD for BTC/USD is back in the bearish zone.
Hourly RSI (Relative Strength Index) – The RSI is now placed well below the 50 level.
Major Support Level – $3,295
Major Resistance Level – $3,475


