
Reason to trust
How Our News is Made
Strict editorial policy that focuses on accuracy, relevance, and impartiality
Ad discliamer
Morbi pretium leo et nisl aliquam mollis. Quisque arcu lorem, ultricies quis pellentesque nec, ullamcorper eu odio.
- Bitcoin price is consolidating losses above the $3,560 support area against the US Dollar.
- There is a short term contracting triangle formed with resistance at $3,625 on the hourly chart of the BTC/USD pair (data feed from Kraken).
- The price may soon make the next move either above $3,650 or below $3,540 in the near term.
Bitcoin price is preparing for the next key break above $3,650 against the US Dollar. A close above $3,650 could trigger bullish moves towards $3,720 and $3,800.
Bitcoin Price Analysis
After trading above the $3,700 level, bitcoin price faced renewed selling pressure against the US Dollar. More importantly, Ethereum’s bearish reaction sparked a downward move below $3,650 in the BTC/USD pair. It declined below the $3,620 support and the 100 hourly simple moving average. Besides, there was a break below the 23.6% Fib retracement level of the last wave from the $3,376 low to $3,716 high. The price even traded below the $3,600 support, but the $3,560 pivot acted as a solid support.
Additionally, the 50% Fib retracement level of the last wave from the $3,376 low to $3,716 high also acted as a support. At the outset, the price is currently holding the $3,560 support, with range moves. It seems like there is a short term contracting triangle formed with resistance at $3,625 on the hourly chart of the BTC/USD pair. Should there be an upside break above the $3,650 resistance, the price may climb towards the $3,700 and $3,750 levels. On the other hand, a downside break below $3,560 and $3,540 might trigger bearish moves. The next key supports are near $3,500 and $3,455.
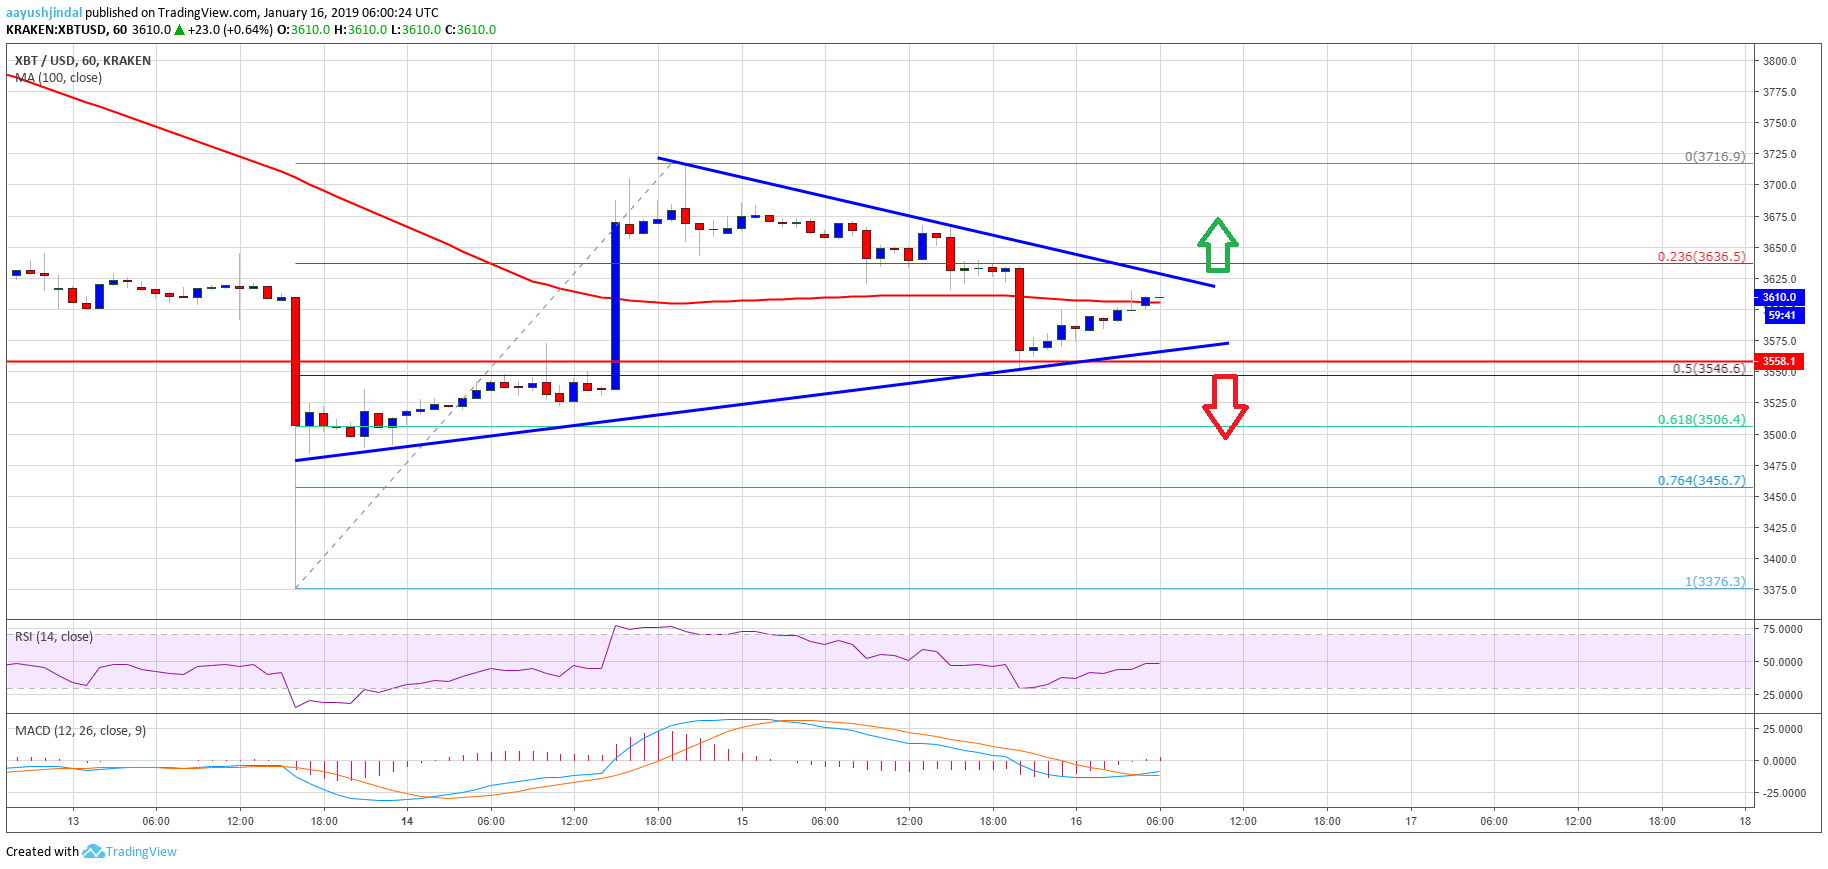
Looking at the chart, bitcoin price is clearly consolidating and preparing for the next move either above $3,650 or below $3,540. The current price action is positive, but a convincing break above $3,650 is must for a decent upward move. If not, it could drop to $3,500 or $3,455.
Technical indicators
Hourly MACD – The MACD for BTC/USD is about to move back in the bullish zone.
Hourly RSI (Relative Strength Index) – The RSI for BTC/USD recovered nicely and it may soon break the 50 level.
Major Support Level – $3,540
Major Resistance Level – $3,650