Reason to trust
How Our News is Made
Strict editorial policy that focuses on accuracy, relevance, and impartiality
Ad discliamer
Morbi pretium leo et nisl aliquam mollis. Quisque arcu lorem, ultricies quis pellentesque nec, ullamcorper eu odio.
- Bitcoin price failed to recover above the $3,650 resistance and declined recently against the US Dollar.
- There was a break below a major contracting triangle with support at $3,590 on the hourly chart of the BTC/USD pair (data feed from Kraken).
- The price is currently trading in a bearish zone and it may accelerate losses to $3,500 and $3,400.
Bitcoin price is under selling pressure below $3,650 against the US Dollar. There are high chances of more losses in BTC below $3,500 and $3,450 in the near term.
Bitcoin Price Analysis
Recently, there was a decent support formed near $3,550 in bitcoin price against the US Dollar. The BTC/USD pair started a short term recovery and moved above the $3,600 and $3,620 resistance levels. There was also a break above the 50% Fib retracement level of the last side from the $3,716 high to $3,549 low. However, the price struggled to hold gains above the $3,650 level and the 100 hourly simple moving average. A clear rejection candle was formed near the $3,650 level.
Besides, the price failed to surpass the 61.8% Fib retracement level of the last side from the $3,716 high to $3,549 low. As a result, there was a bearish reaction and the price declined below $3,620 and $3,600. More importantly, there was a break below a major contracting triangle with support at $3,590 on the hourly chart of the BTC/USD pair. The pair is now trading well below $3,620 and the 100 hourly SMA. Should bitcoin gain bearish momentum below the $3,550 support, the price may tumble below the $3,500 and $3,450 support levels.
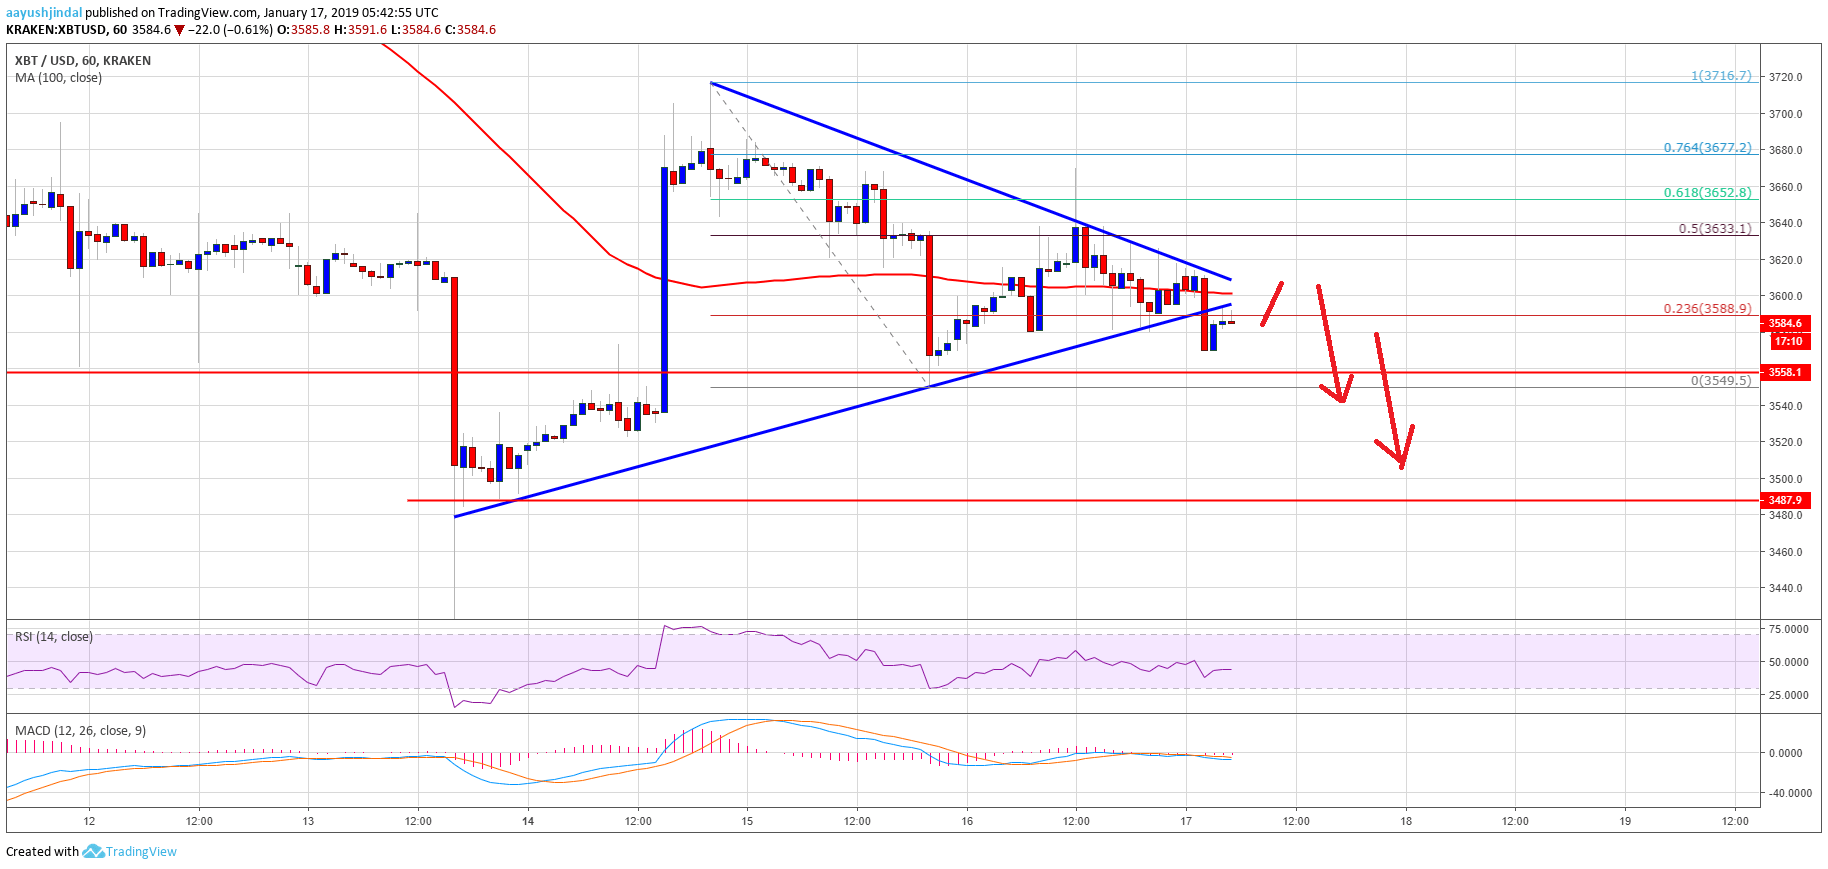
Looking at the chart, bitcoin price is showing a few bearish signs below the $3,620 and $3,650 resistance levels. Therefore, to start a decent upward move, the price must surpass the $3,650 pivot level. If not, there is a risk of a sharp decline below $3,500 and $3,450 in the coming sessions.
Technical indicators
Hourly MACD – The MACD for BTC/USD has moved back in the bearish zone.
Hourly RSI (Relative Strength Index) – The RSI for BTC/USD is now well below 50 level, with bearish signs.
Major Support Level – $3,550
Major Resistance Level – $3,650