
Reason to trust
How Our News is Made
Strict editorial policy that focuses on accuracy, relevance, and impartiality
Ad discliamer
Morbi pretium leo et nisl aliquam mollis. Quisque arcu lorem, ultricies quis pellentesque nec, ullamcorper eu odio.
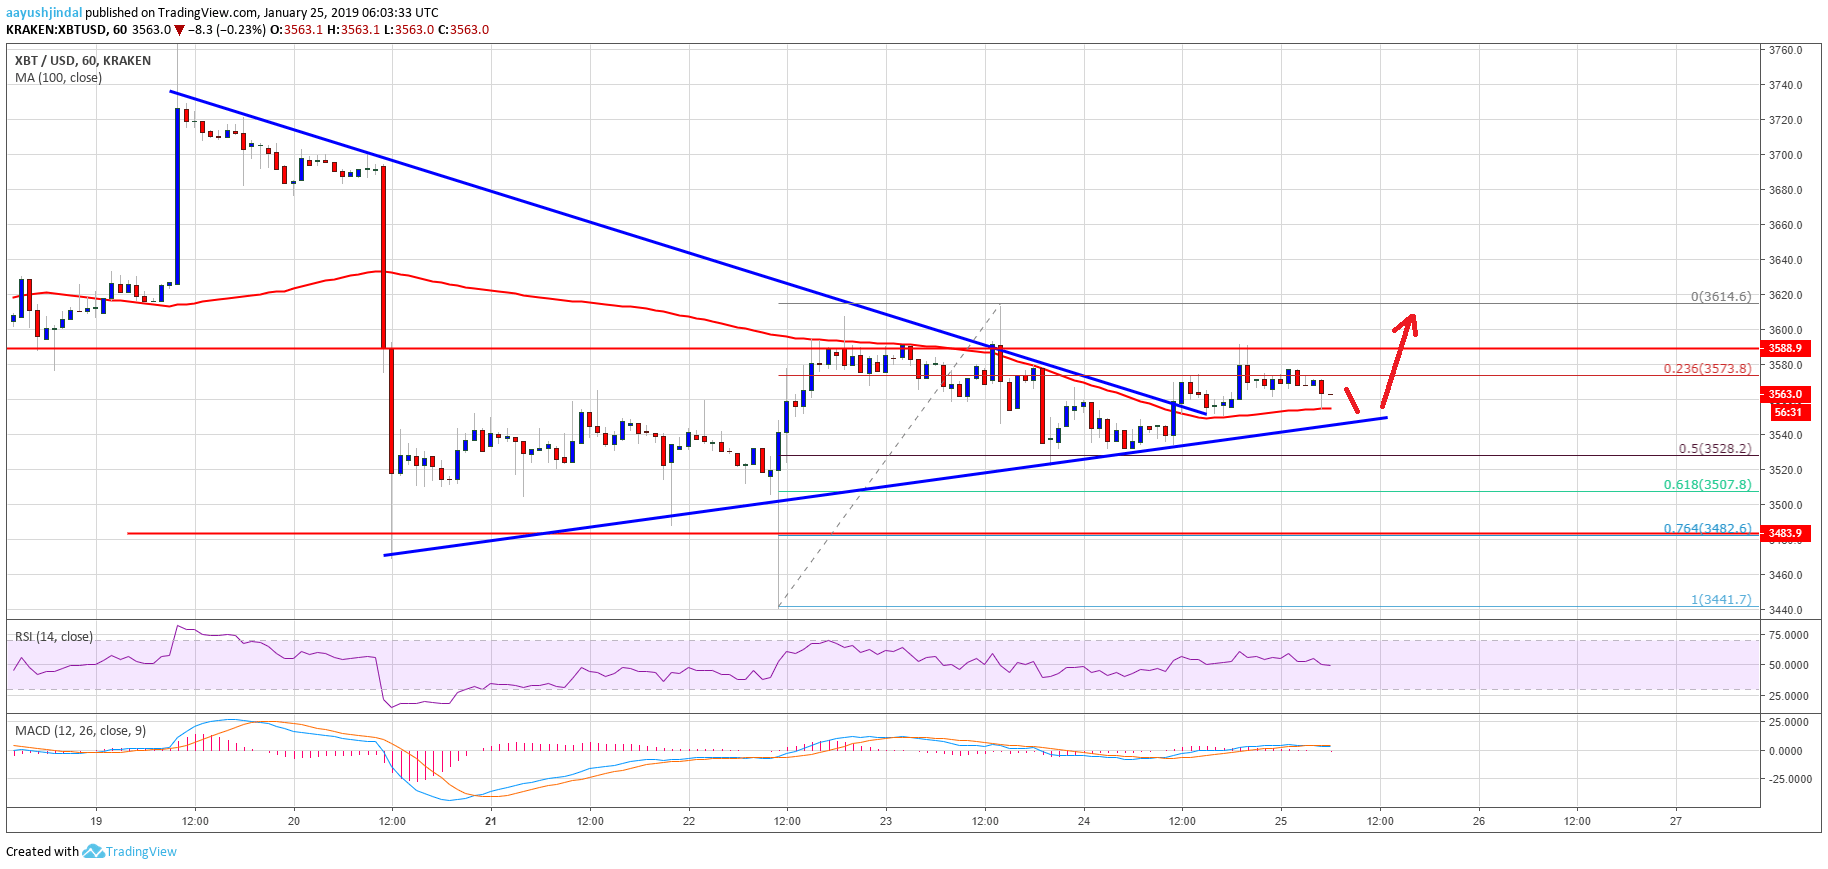
- Bitcoin price traded higher and broke the $3,550 resistance level against the US Dollar.
- There is a connecting bullish trend line formed with support at $3,545 on the hourly chart of the BTC/USD pair (data feed from Kraken).
- The price is showing positive signs above the $3,545 level, but it must break the $3,585 resistance.
Bitcoin price is slowly moving higher with positive signs against the US Dollar. BTC needs to overcome sellers near $3,580 and $3,600 for a sustained move higher in the near term.
Bitcoin Price Analysis
After forming a support base above the $3,500 level, bitcoin price started an upside correction against the US Dollar. The BTC/USD pair gained momentum above the $3,545 and $3,550 resistance levels. There was also a close above the $3,550 level and the 100 hourly simple moving average. Besides, buyers pushed the price above this week’s crucial bearish trend line with resistance at $3,555. However, the price is facing a lot of hurdles near the $3,585 and $3,600 resistance levels.
If there is a successful close above the $3,600 resistance, the price may continue to move higher. The next important resistances are $3,750 and $3,785, followed by the key $3,800 barrier. On the downside, an initial support is near the $3,550 level and the 100 hourly simple moving average. Moreover, there is a connecting bullish trend line formed with support at $3,545 on the hourly chart of the BTC/USD pair. Below the trend line, the 50% Fib retracement level of the last leg from the $3,440 low to $3,614 high is at $3,528. Therefore, there many supports on the downside above the $3,520 level.
Looking at the chart, bitcoin price is showing a few positive signs above the $3,550 support level. Having said that, buyers need to gain traction above $3,600 for a sustained move higher. If not, there is a risk of a break below $3,500 and the 61.8% Fib retracement level of the last leg from the $3,440 low to $3,614 high.
Technical indicators
Hourly MACD – The MACD for BTC/USD is mostly flat in the bearish zone.
Hourly RSI (Relative Strength Index) – The RSI for BTC/USD is currently flirting with the 50 level.
Major Support Level – $3,500
Major Resistance Level – $3,600