
Reason to trust
How Our News is Made
Strict editorial policy that focuses on accuracy, relevance, and impartiality
Ad discliamer
Morbi pretium leo et nisl aliquam mollis. Quisque arcu lorem, ultricies quis pellentesque nec, ullamcorper eu odio.
- Bitcoin price failed to stay above the $3,520 and $3,480 support levels against the US Dollar.
- There is a strong resistance formed near $3,500 and a bearish trend line on the hourly chart of the BTC/USD pair (data feed from Kraken).
- The price tested the $3,400 support and it remains at a risk of more losses towards $3,200 or $3,000.
Bitcoin price moved into a bearish zone below $3,500 against the US Dollar. BTC might extend the current decline towards the next key support at $3,200 or even $3,000.
Bitcoin Price Analysis
This past week, we discussed a couple of important hurdles near $3,600 and $3,650 for bitcoin price against the US Dollar. The BTC/USD pair failed to surpass the $3,650 resistance and finally reacted to the downside. There was a sharp decline below the $3,520 support, which dragged Ethereum, ripple and altcoins lower. The price even broke the $3,480 support level and the 100 hourly simple moving average. During the decline, there was a break below a connecting support trend line at $3,485. It opened the doors for more losses below $3,450.
A new weekly low was formed at $3,403 and the price moved into a bearish zone. If there is an upside correction, the price may find offers near $3,450. The next resistance is the 23.6% Fib retracement level of the last drop from the $3,672 high to $3,403 low. The main resistance is near $3,500 and a bearish trend line on the hourly chart of the BTC/USD pair. Therefore, if the pair corrects higher, it is likely to face sellers near $3,450 or $3,500.
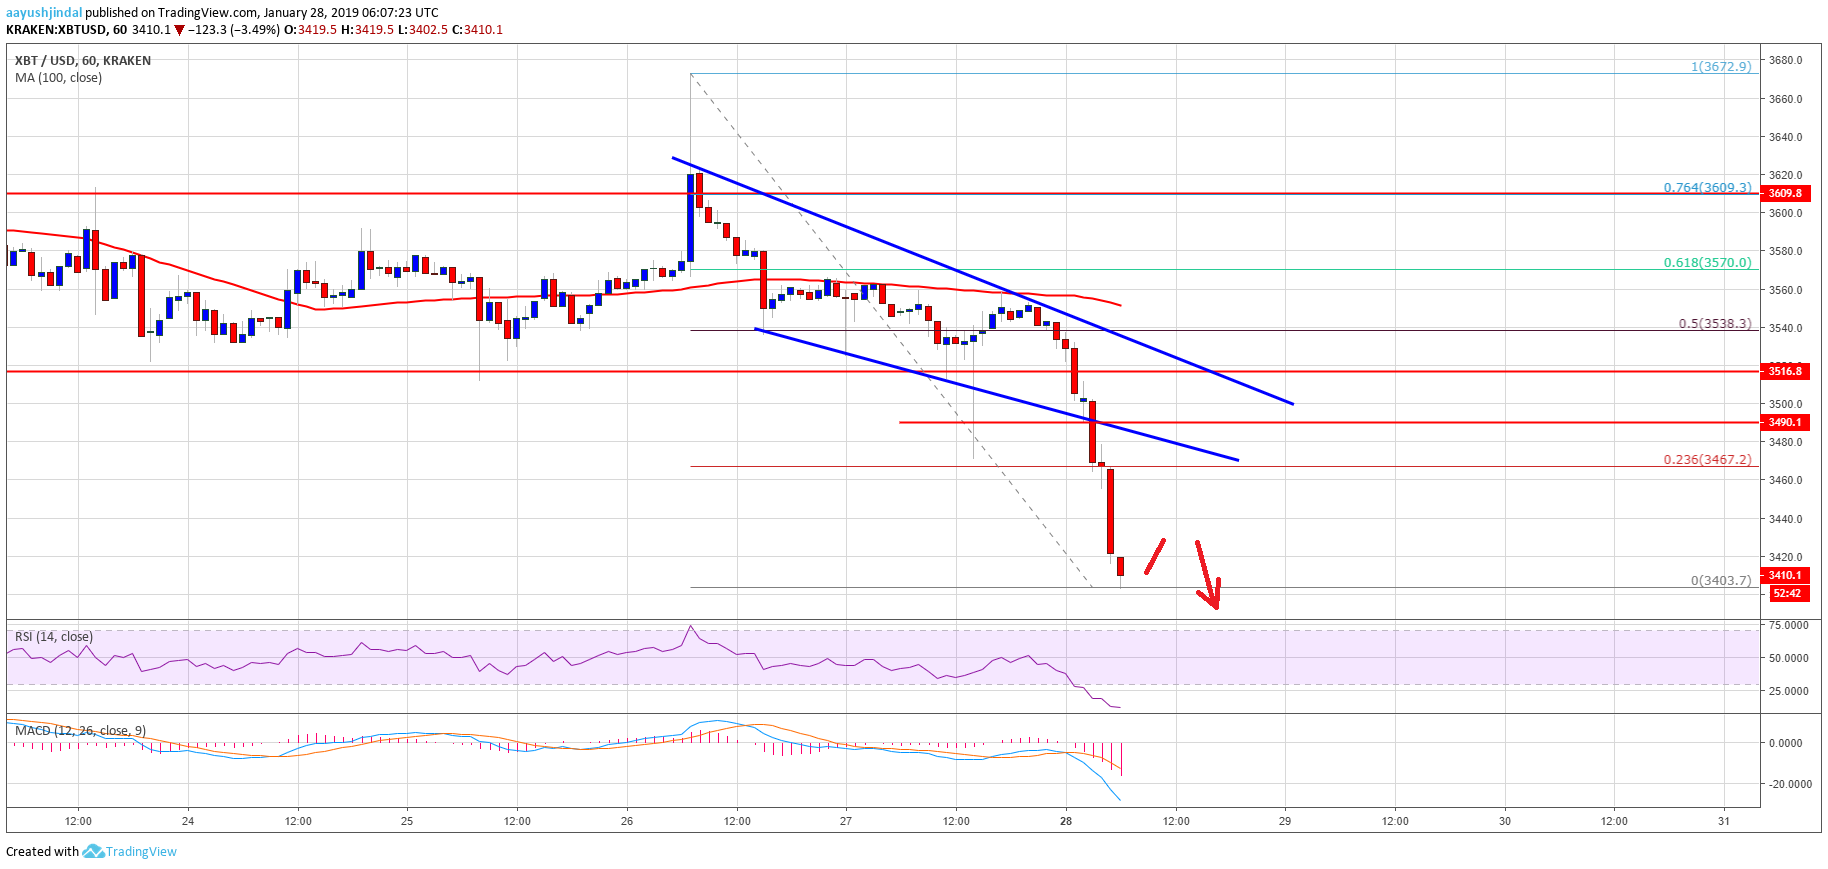
Looking at the chart, bitcoin price is back in a negative zone below $3,500. It seems like there are chances of more losses towards the $3,200 support. If $3,200 fails to hold, the price may test $3,000. On the other hand, a proper close above $3,500 might push the price back in a positive zone.
Technical indicators
Hourly MACD – The MACD for BTC/USD is placed heavily in the bearish zone.
Hourly RSI (Relative Strength Index) – The RSI for BTC/USD is placed in the oversold area below 20.
Major Support Level – $3,200
Major Resistance Level – $3,500


