
Reason to trust
How Our News is Made
Strict editorial policy that focuses on accuracy, relevance, and impartiality
Ad discliamer
Morbi pretium leo et nisl aliquam mollis. Quisque arcu lorem, ultricies quis pellentesque nec, ullamcorper eu odio.
- ETH price recovered recently and broke the $105, $106 and $109 resistance levels against the US Dollar.
- Yesterday’s highlighted important bearish trend line was breached with resistance near $106 on the hourly chart of ETH/USD (data feed via Kraken).
- The pair is now placed nicely above the $106 level and it could recover towards the $113 or $114 level.
Ethereum price started a short term correction against the US Dollar and bitcoin. ETH/USD remains supported for a recovery towards the key $114 resistance level in the near term.
Ethereum Price Analysis
After trading as low as $101, ETH price started trading in a range above $103 against the US Dollar. The ETH/USD pair formed a couple of breakout patterns with resistance near the $105 and $106 levels. Finally, there was an upside move and the price broke the $106 resistance. Buyers pushed the price above the 50% Fib retracement level of the last drop from the $115 swing high to $101 swing. Moreover, the price traded above the $106 level and the 100 hourly simple moving average.
Besides, yesterday’s highlighted important bearish trend line was breached with resistance near $106 on the hourly chart of ETH/USD. The pair spiked above the $109 and $110 resistance levels and later corrected lower. It is currently testing the 23.6% Fib retracement level of the recent wave from the $103 low to $111 high. However, there are many supports on the downside near the $107 and $106 levels. More importantly, the 100 hourly simple moving average is near the $107 level. The 50% Fib retracement level of the recent wave from the $103 low to $111 high is also near $107.
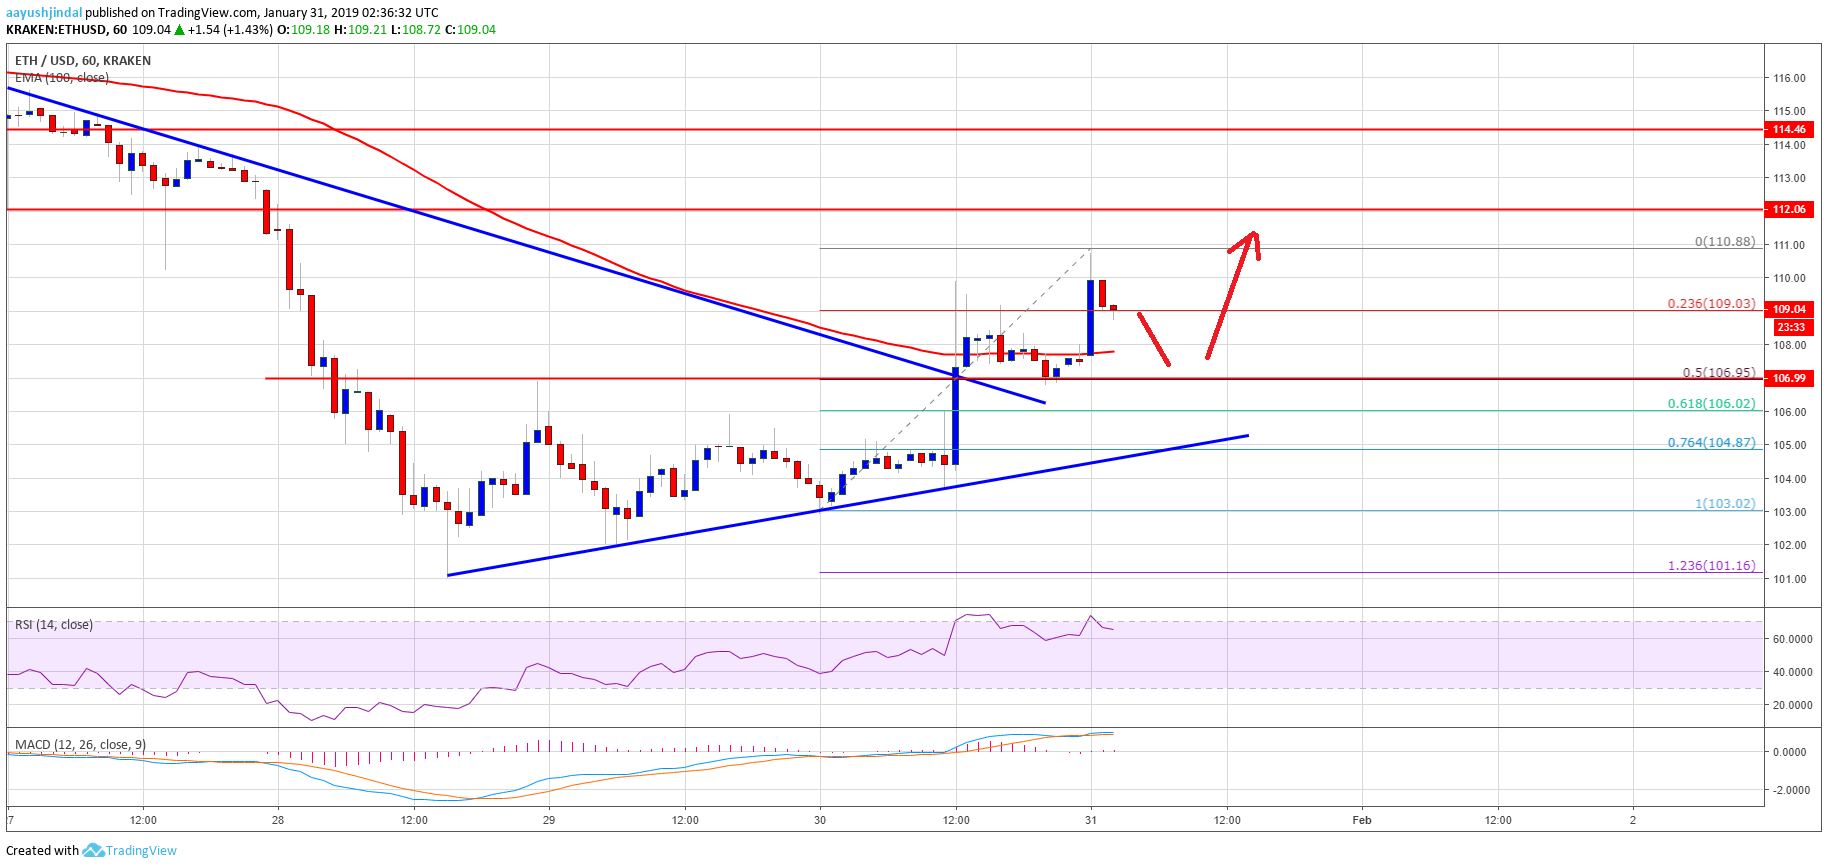
Looking at the chart, ETH price may dip a few points in the short term, but it remains supported near $107 and $106. It seems like the price could recover towards the $113 and $114 resistances, where sellers are likely to emerge.
ETH Technical Indicators
Hourly MACD – The MACD for ETH/USD is about to move back in the bearish zone.
Hourly RSI – The RSI for ETH/USD is placed nicely above the 60 level, with positive signs.
Major Support Level – $107
Major Resistance Level – $114


