
Reason to trust
How Our News is Made
Strict editorial policy that focuses on accuracy, relevance, and impartiality
Ad discliamer
Morbi pretium leo et nisl aliquam mollis. Quisque arcu lorem, ultricies quis pellentesque nec, ullamcorper eu odio.
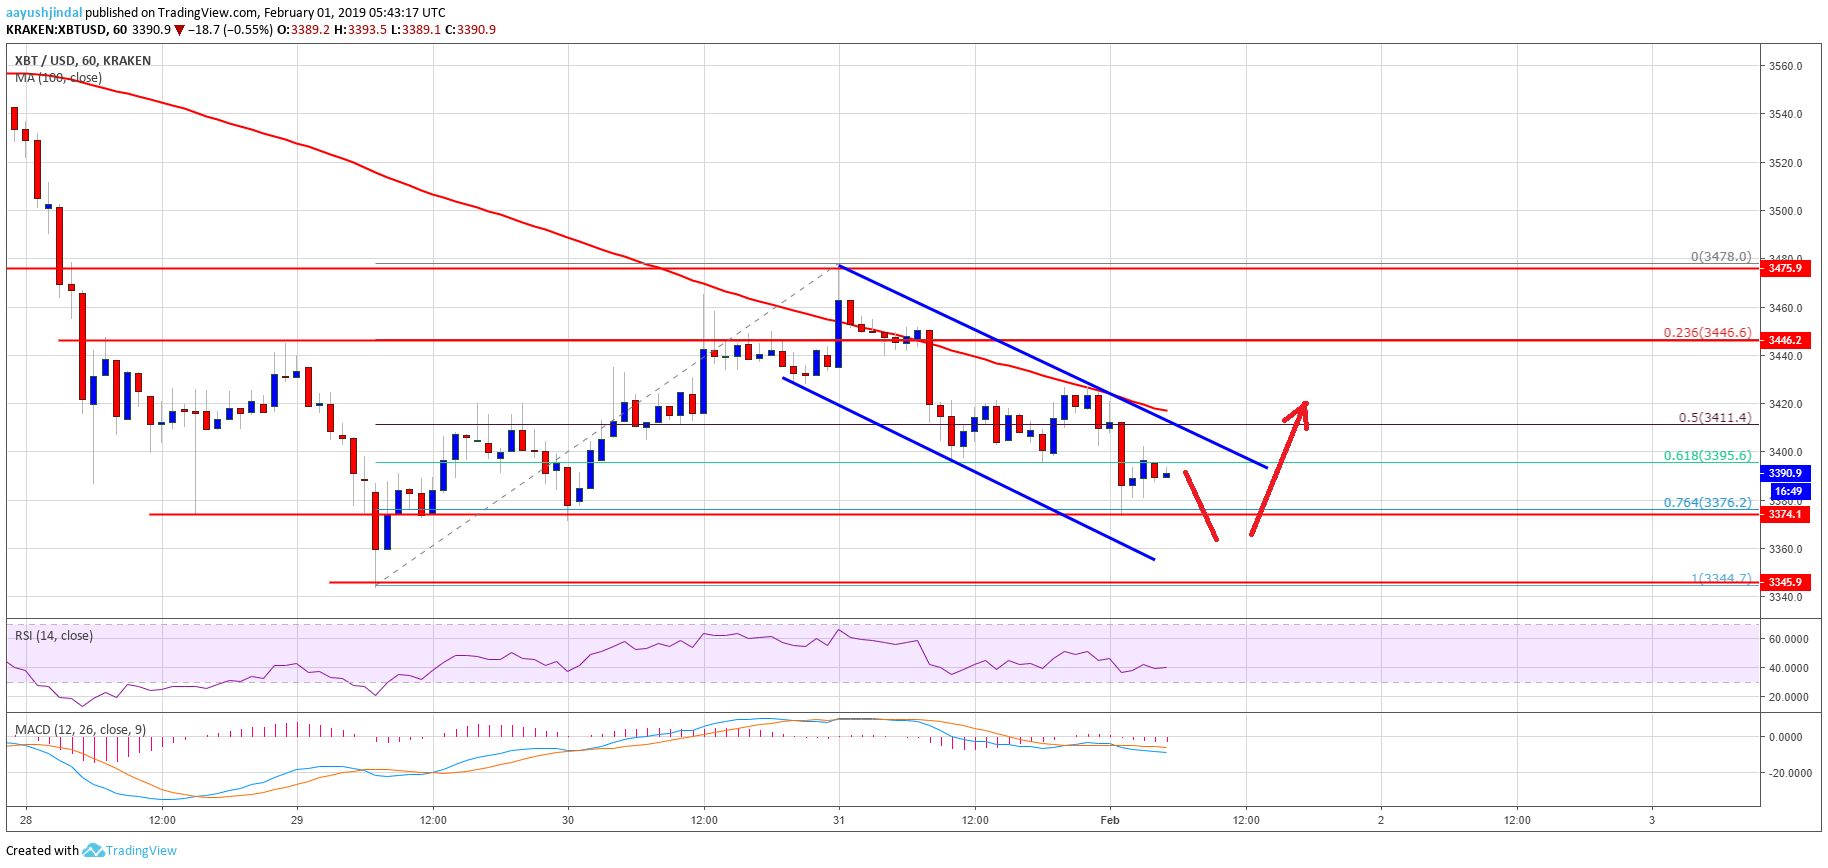
- Bitcoin price failed near the $3,478-$3,480 resistance zone and declined recently against the US Dollar.
- There is a major declining channel in place with resistance at $3,410 on the hourly chart of the BTC/USD pair (data feed from Kraken).
- The price could dip a few points before making another attempt to recover above $3,440.
Bitcoin price is struggling to gain momentum above $3,400 against the US Dollar. BTC price might test the $3,360 support before a fresh upward move above the $3,400 level.
Bitcoin Price Analysis
Recently, we saw a decent recovery above the $3,440 level in bitcoin price against the US Dollar. However, the BTC/USD pair failed to break the $3,478-$3,480 resistance zone. As a result, there was a fresh decline below the $3,440 and $3,420 support levels. There was also a close below the $3,420 level and the 100 hourly simple moving average. Moreover, the price traded below the 50% Fib retracement level of the last wave from the $3,344 low to $3,478 high. Finally, the price broke the $3,400 level and tested the $3,375 support.
At the outset, the 76.4% Fib retracement level of the last wave from the $3,344 low to $3,478 high is acting as a support. If there is a downside break below the $3,375 support, the price might find bids near the $3,360 and $3,350 support levels. Below these, the price could trade to a new yearly low below the $3,320 level. On the upside, an initial resistance awaits at $3,400. There is also a major declining channel in place with resistance at $3,410 on the hourly chart of the BTC/USD pair. A proper break above the channel and $3,420 could open the doors for more gains in the near term.
Looking at the chart, bitcoin price seems to be facing a lot of hurdles below the $3,450 and $3,500 resistance levels. However, downsides are likely to be limited as long as the price is above $3,320.
Technical indicators
Hourly MACD – The MACD is currently struggling in the bearish zone.
Hourly RSI (Relative Strength Index) – The RSI for BTC/USD is currently below the 40 level, with a bearish angle.
Major Support Level – $3,350
Major Resistance Level – $3,480


