
Reason to trust
How Our News is Made
Strict editorial policy that focuses on accuracy, relevance, and impartiality
Ad discliamer
Morbi pretium leo et nisl aliquam mollis. Quisque arcu lorem, ultricies quis pellentesque nec, ullamcorper eu odio.
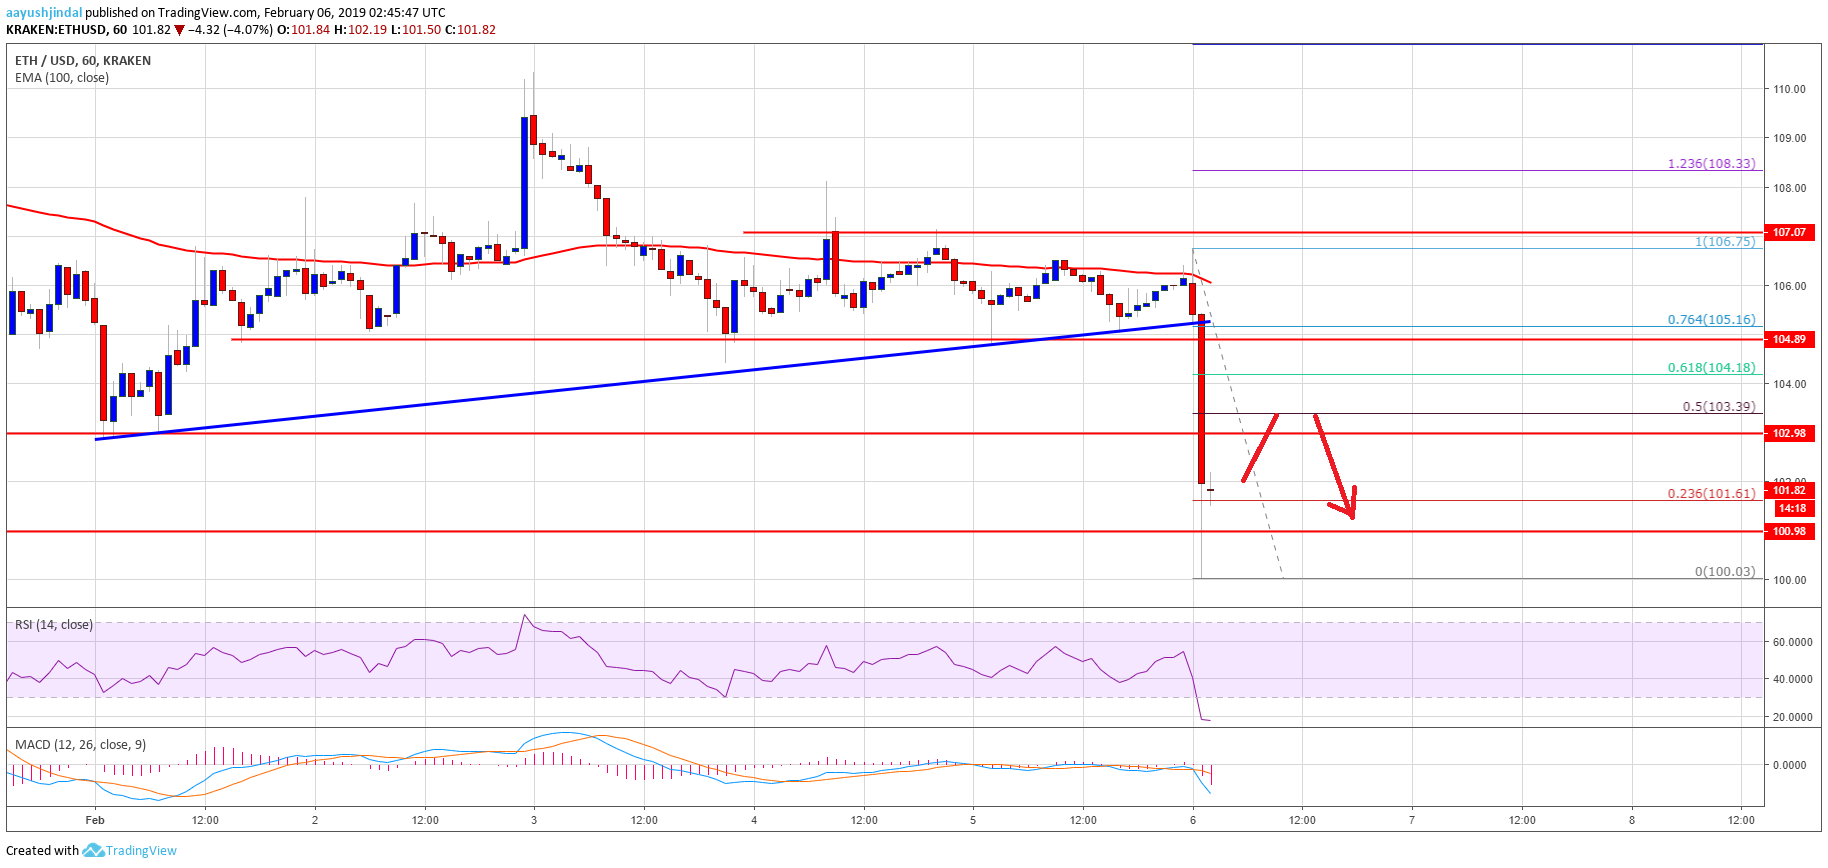
- ETH price declined sharply and broke the $105 support area against the US Dollar.
- There was a break below a major bullish trend line with support at $105 on the hourly chart of ETH/USD (data feed via Kraken).
- The pair dived towards the $100 support area and it is currently consolidating losses.
Ethereum price declined heavily against the US Dollar and bitcoin. ETH/USD is now at a risk of more losses below the $100 and $958 support levels in the near term.
Ethereum Price Analysis
After multiple rejections near the $107 and $108 resistance levels, ETH price declined sharply against the US Dollar. The ETH/USD pair tumbled and broke the $105 and $103 support levels. There was also a close below the $105 level and the 100 hourly simple moving average. The decline was sharp since the price even broke the last swing low near the $102 level. It opened the doors for a test of the 1.236 Fib extension level of the last wave from the $103 swing low.
More importantly, there was a break below a major bullish trend line with support at $105 on the hourly chart of ETH/USD. The pair tested the $100 support level, where buyers emerged. At the moment, the price is correcting higher above the $101 level. There was a break above the 23.6% Fib retracement level of the recent decline from the $106 high to $100 low. However, there are many hurdles on the upside near the $103, $104 and $105 levels. The 50% Fib retracement level of the recent decline from the $106 high to $100 low is also near the $103 level. Besides, the previous support near the $105 level might act as a strong resistance for buyers.
Looking at the chart, ETH price is clearly under a lot of pressure below the $107 and $105 levels. That’s why there is a risk of more losses below the $100 and $98 supports.
ETH Technical Indicators
Hourly MACD – The MACD for ETH/USD is placed strongly in the bearish zone.
Hourly RSI – The RSI for ETH/USD is currently in the oversold zone, with no recovery sign.
Major Support Level – $100
Major Resistance Level – $105


