
Reason to trust
How Our News is Made
Strict editorial policy that focuses on accuracy, relevance, and impartiality
Ad discliamer
Morbi pretium leo et nisl aliquam mollis. Quisque arcu lorem, ultricies quis pellentesque nec, ullamcorper eu odio.
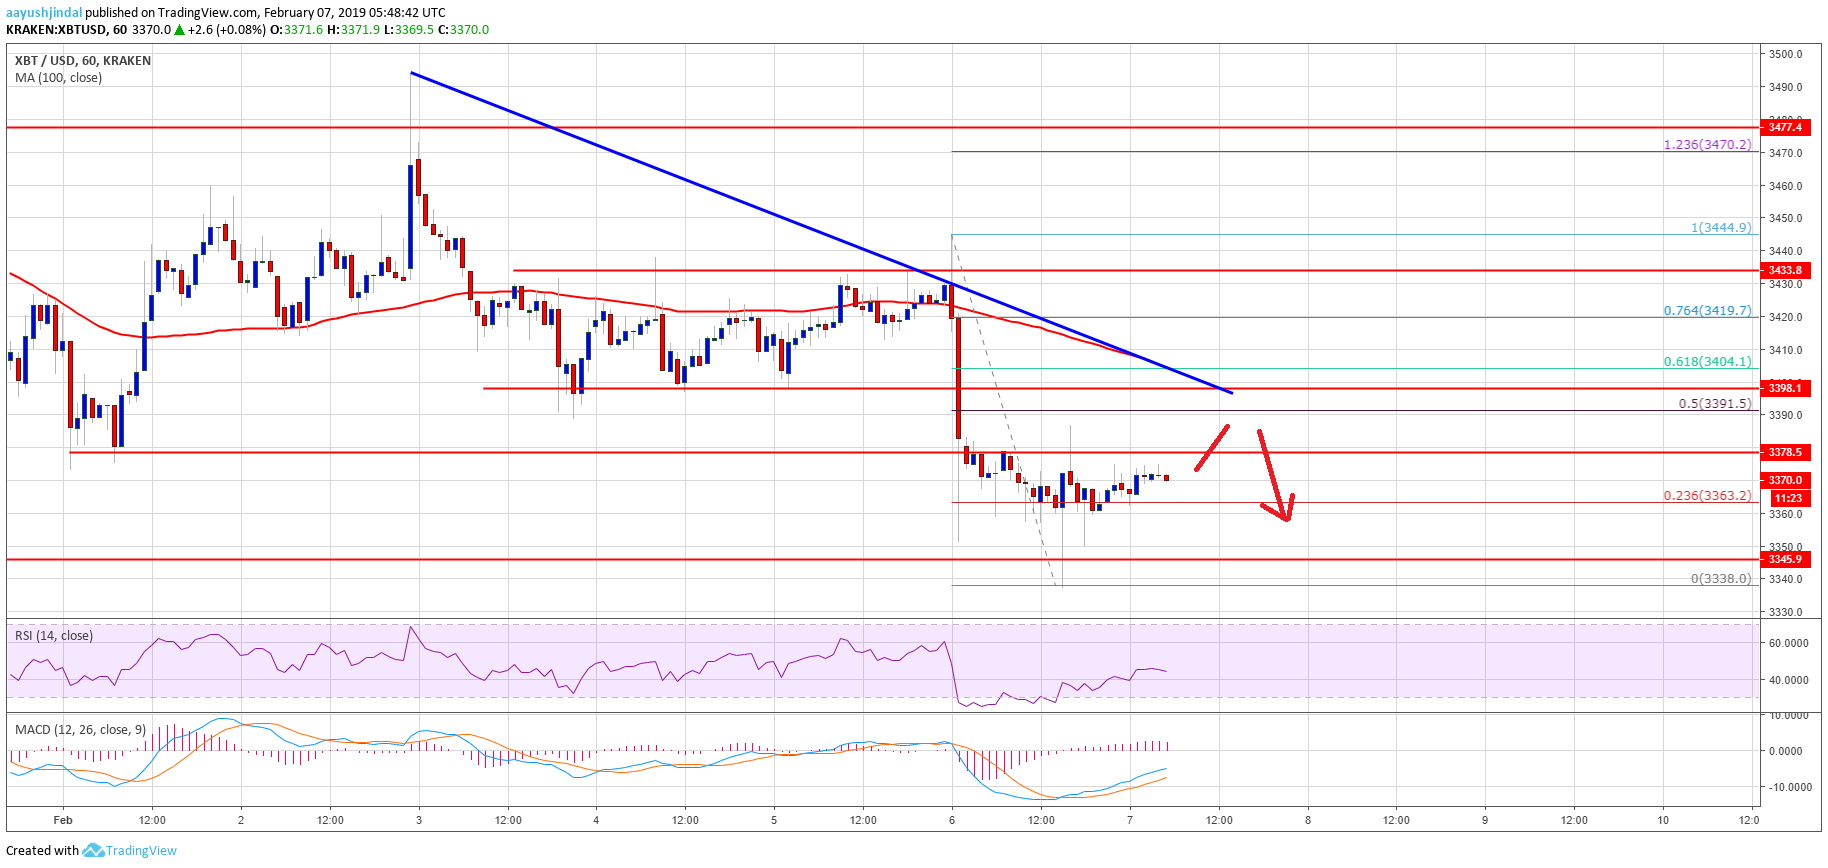
- Bitcoin price declined further and traded towards the $3,320 support level against the US Dollar.
- There is a key connecting bearish trend line formed with resistance at $3,400 on the hourly chart of the BTC/USD pair (data feed from Kraken).
- The price could correct higher, but it is likely to face sellers near $3,375 and $3,400.
Bitcoin price extended losses below the $3,350 support against the US Dollar. BTC might attempt a recovery, but sellers are likely to defend gains above the $3,400 resistance.
Bitcoin Price Analysis
Yesterday, we saw a major decline below the $3,400 support in bitcoin price against the US Dollar. The BTC/USD pair even broke the $3,350 support and traded close to the $3,320 level. A new weekly low was formed at $3,338 and the price settled well below the 100 hourly simple moving average. Later, the price started consolidating gains and corrected above the $3,350 level. There was a break above the 23.6% Fib retracement level of the recent drop from the $3,445 swing high to $3,338 low. However, the upward move was capped by the $3,375 resistance levels.
Besides, there are many hurdles for buyers near the $3,400 and $3,420 levels. There is also a key connecting bearish trend line formed with resistance at $3,400 on the hourly chart of the BTC/USD pair. The trend line coincides with the 50% Fib retracement level of the recent drop from the $3,445 swing high to $3,338 low. Moreover, the 100 hourly simple moving average is near the trend line and the $3,410 level. Therefore, upsides from the current levels are likely to face sellers near $3,375 and $3,400.
Looking at the chart, bitcoin price is trading in a bearish zone below the $3,400 resistance. Only a daily close above $3,400 and $3,420 could open the doors for more gains. On the downside, the main support are $3,320 and $3,300.
Technical indicators
Hourly MACD – The MACD moved back in the bullish, but it may dive back in the bearish zone.
Hourly RSI (Relative Strength Index) – The RSI for BTC/USD recovered recently, but it failed to move above the 50 level.
Major Support Level – $3,320
Major Resistance Level – $3,400


