
Reason to trust
How Our News is Made
Strict editorial policy that focuses on accuracy, relevance, and impartiality
Ad discliamer
Morbi pretium leo et nisl aliquam mollis. Quisque arcu lorem, ultricies quis pellentesque nec, ullamcorper eu odio.
- Ripple price corrected higher, but it failed to move above $0.2900 and $0.2920 against the US dollar.
- Yesterday’s highlighted key bearish trend line is intact with resistance near $0.2890 on the hourly chart of the XRP/USD pair (data source from Kraken).
- The pair must break the $0.2900 and $0.2920 resistance levels to start a short term upward move.
Ripple price is trading in a bearish zone with a negative angle against the US Dollar and Bitcoin. XRP/USD could continue to move down and it may even break the $0.2850 support level.
Ripple Price Analysis
After trading as low as $0.2850, ripple started a minor upside correction against the US Dollar. The XRP/USD pair traded above the $0.2860 and $0.2880 resistance levels. It also moved above the 23.6% Fib retracement level of the recent decline from the $0.2987 high to $0.2849 low. However, there was a strong rejection near the $0.2910 and $0.2920 resistance levels. The price even failed to test the $0.2930 pivot level and later traded in a tight range. More importantly, it slowly traded lower and settled below $0.2900 plus the 100 hourly simple moving average.
On the upside, there are many hurdles near the $0.2900 and $0.2920 levels. Besides, yesterday’s highlighted key bearish trend line is intact with resistance near $0.2890 on the hourly chart of the XRP/USD pair. The 50% Fib retracement level of the recent decline from the $0.2987 high to $0.2849 low is also near $0.2918. Therefore, the price is likely to struggle near the $0.2900 and $0.2920 resistance levels. On the downside, an initial support is at $0.2850, below which there is a risk of a drop to $0.2800.
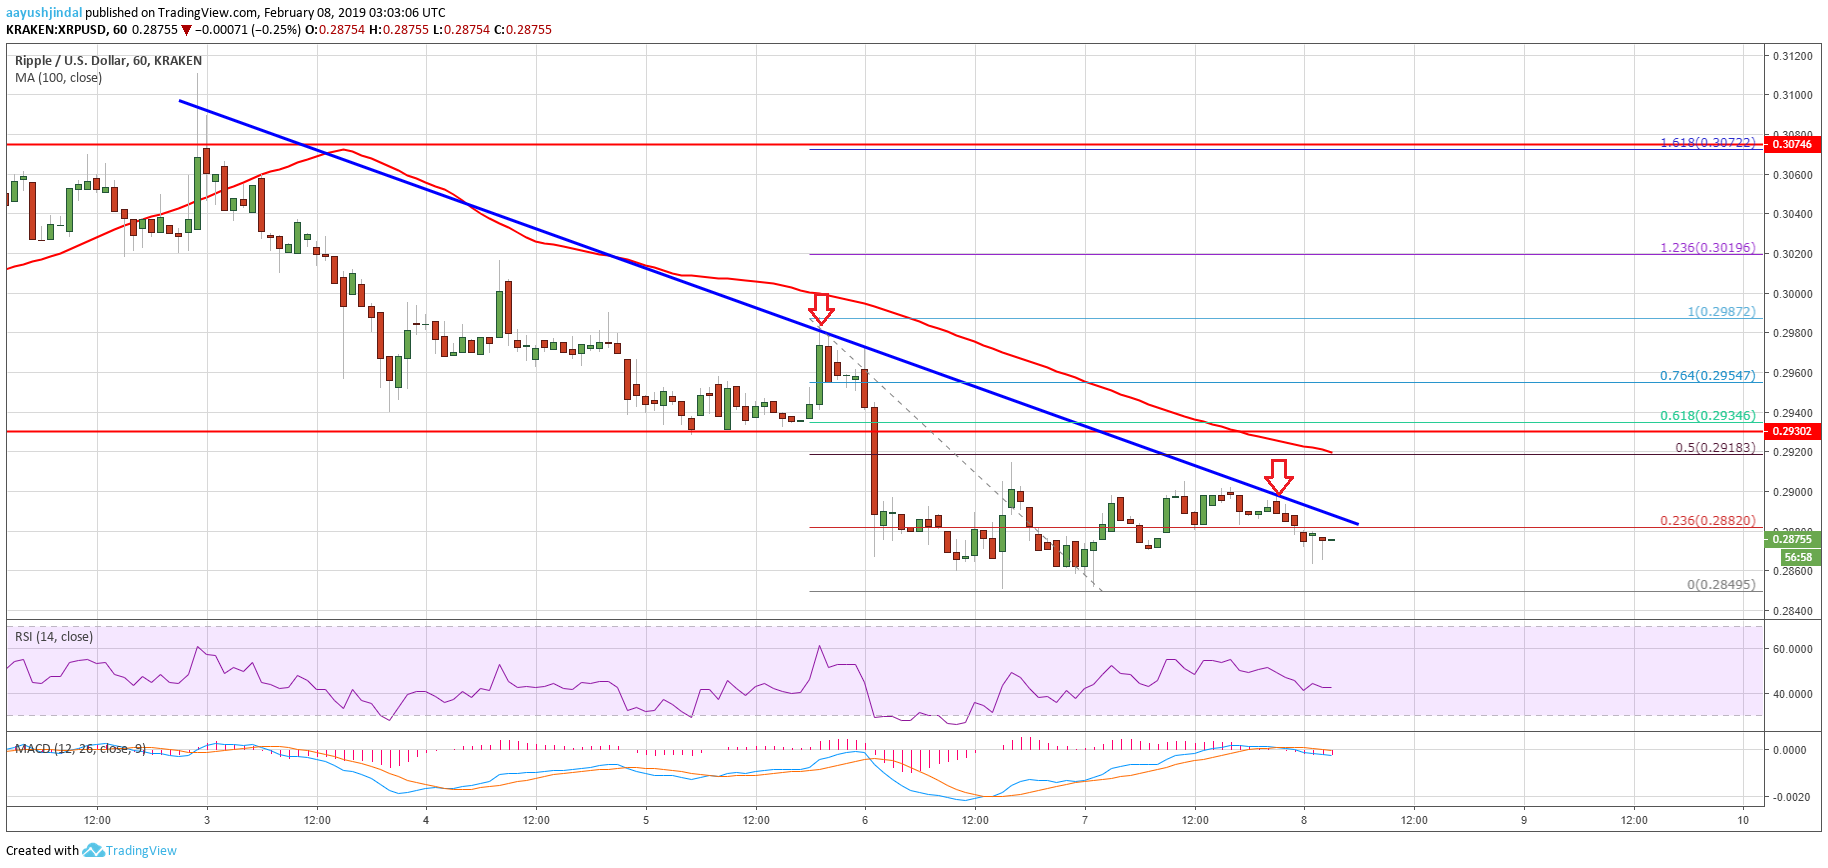
Looking at the chart, ripple price is clearly placed in a bearish zone below $0.2920. As long as the price is below the $0.2930 pivot, sellers remain in action. They could soon push the price below $0.2850 and $0.2820 in the near term.
Technical Indicators
Hourly MACD – The MACD for XRP/USD is slowly gaining pace in the bearish zone.
Hourly RSI (Relative Strength Index) – The RSI for XRP/USD is back below the 50 and 45 levels, with bearish signs.
Major Support Level – $0.2850
Major Resistance Level – $0.2920


