
Reason to trust
How Our News is Made
Strict editorial policy that focuses on accuracy, relevance, and impartiality
Ad discliamer
Morbi pretium leo et nisl aliquam mollis. Quisque arcu lorem, ultricies quis pellentesque nec, ullamcorper eu odio.
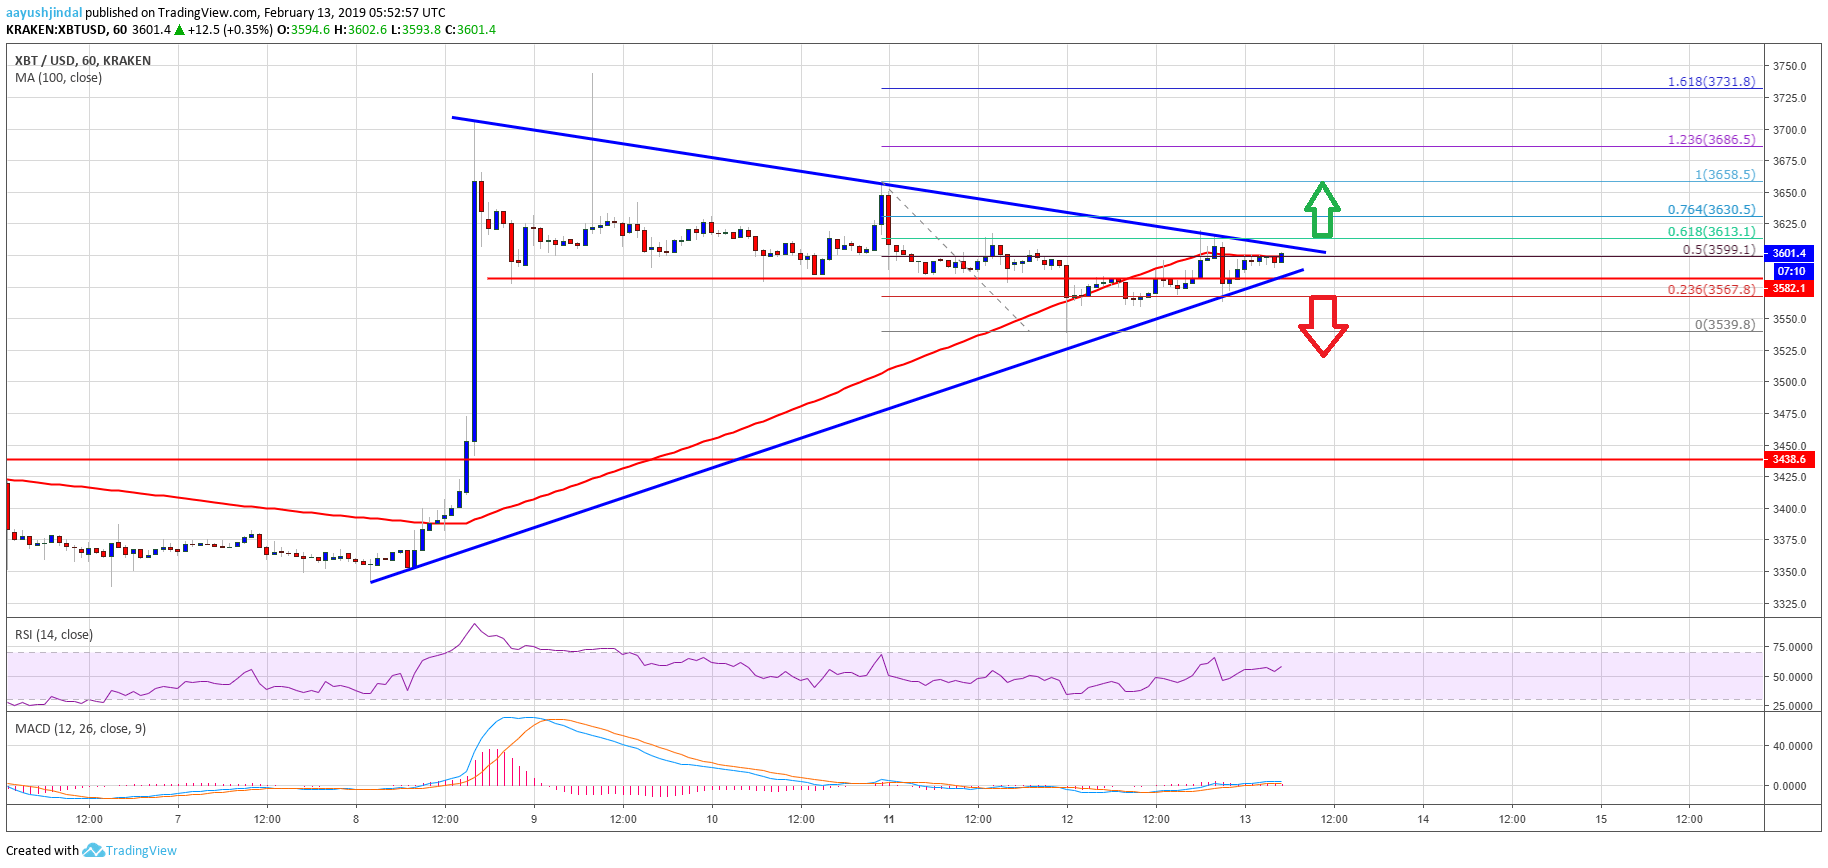
- Bitcoin price is holding the key support near the $3,580 zone against the US Dollar.
- Yesterday’s contracting triangle is in place with resistance near $3,610 on the hourly chart of the BTC/USD pair (data feed from Kraken).
- The price is likely preparing for the next bullish break above $3,610, $3,620 and $3,650.
Bitcoin price is setting up for the next crucial break against the US Dollar. BTC could gain bullish momentum if it clears the $3,620 and $3,650 resistance levels in the near term.
Bitcoin Price Analysis
Recently, we saw an intermediate high at $3,658 in bitcoin price against the US Dollar. Later, the BTC/USD pair corrected lower and traded below the $3,600 and $3,580 support levels. However, the $3,540 and $3,550 support levels acted as a strong barrier for sellers. A low was formed at $3,539 and later the price bounced back above $3,580. The price broke the $3,600 resistance and the 100 hourly simple moving average. Besides, there was a break above the 50% Fib retracement level of the last drop from the $3,658 high to $3,539 low.
However, the price faced a strong resistance near the $3,610-3,620 zone. More importantly, yesterday’s contracting triangle is in place with resistance near $3,610 on the hourly chart of the BTC/USD pair. The pair seems to be struggling near the 61.8% Fib retracement level of the last drop from the $3,658 high to $3,539 low. Therefore, a successful break above $3,610 and follow through above $3,620 could set the pace for more gains. The main resistance is at $3,650, above which the price might revisit $3,720. On the other hand, a downside break below $3,580 could encourage sellers to push the price further lower.
Looking at the chart, bitcoin price seems to be setting up for the next key break either above $3,620 or below $3,580. The price action is positive, but buyers need to gain strength above $3,620 for a proper follow through.
Technical indicators
Hourly MACD – The MACD is currently flat in the bullish zone.
Hourly RSI (Relative Strength Index) – The RSI for BTC/USD is placed above the 50 level, with a bullish angle.
Major Support Level – $3,580
Major Resistance Level – $3,620


