
Reason to trust
How Our News is Made
Strict editorial policy that focuses on accuracy, relevance, and impartiality
Ad discliamer
Morbi pretium leo et nisl aliquam mollis. Quisque arcu lorem, ultricies quis pellentesque nec, ullamcorper eu odio.
- Bitcoin price stayed above the key $3,560 support area, with range moves against the US Dollar.
- This’s week’s followed bearish trend line is intact with resistance at $3,590 on the hourly chart of the BTC/USD pair (data feed from Kraken).
- The price could gain bullish momentum if there is a proper close above $3,590 and $3,600.
Bitcoin price is trading nicely in a bullish zone above $3,560 against the US Dollar. BTC is likely to accelerate gains above $3,600 as long as the price stays above the $3,540 support.
Bitcoin Price Analysis
After trading as low as $3,538, bitcoin price moved higher against the US Dollar. The BTC/USD pair broke the $3,560 and $3,575 resistance levels. There was even a spiked above the $3,600 resistance and the 100 hourly simple moving average. However, the price struggled to hold gains above the $3,600 and $3,610 levels. It was rejected near the 61.8% Fib retracement level of the downside move from the $3,660 high to $3,538 low. The price declined below $3,580, but there was a fresh upward move above the $3,600 level. A new intraday high was formed at $3,632 and the price dipped below $3,585.
Sellers pushed the price below the 61.8% Fib retracement level of the last wave from the $3,538 low to $3,632 high. However, the decline was protected by the key $3,560 support area. Besides, the 76.4% Fib retracement level of the last wave from the $3,538 low to $3,632 high acted as a support. At the outset, the price is moving higher towards the $3,600 resistance. More importantly, this week’s followed bearish trend line is intact with resistance at $3,590 on the hourly chart of the BTC/USD pair. Therefore, a successful break above the trend line and $3,600 is must for buyers to gain traction. The next targets for buyers could be $3,630 and $3,680 in the near term.
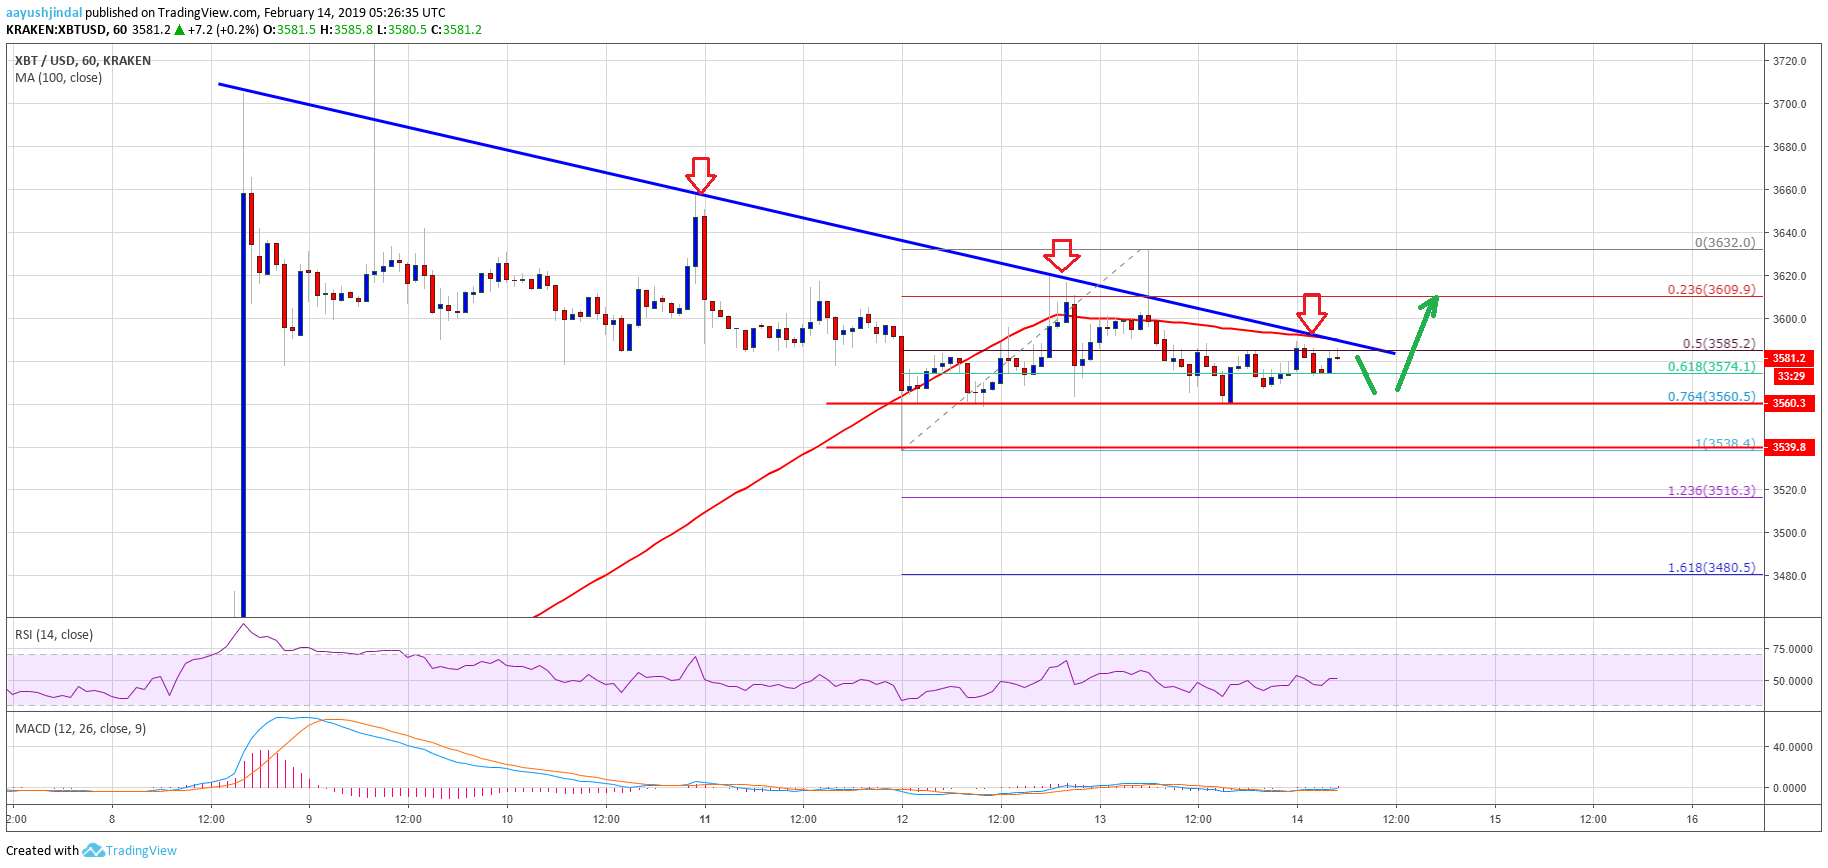
Looking at the chart, bitcoin price is confined in a tiny range below the $3,600 resistance. On the downside, the main support is at $3,560, below which there is a risk of a drop towards the $3,530 support area. Should sellers regain strength, there are chances of an extended correction towards the $3,480 level. An intermediate support is at $3,515 and $3,516. These levels represent the 1.236 Fib extension level of the last wave from the $3,538 low to $3,632 high.
Technical indicators
Hourly MACD – The MACD is mostly flat in the bearish zone, with a few positive signs.
Hourly RSI (Relative Strength Index) – The RSI for BTC/USD just moved above the 50 level, but it shows lack in momentum.
Major Support Level – $3,560
Major Resistance Level – $3,600


