Reason to trust
How Our News is Made
Strict editorial policy that focuses on accuracy, relevance, and impartiality
Ad discliamer
Morbi pretium leo et nisl aliquam mollis. Quisque arcu lorem, ultricies quis pellentesque nec, ullamcorper eu odio.
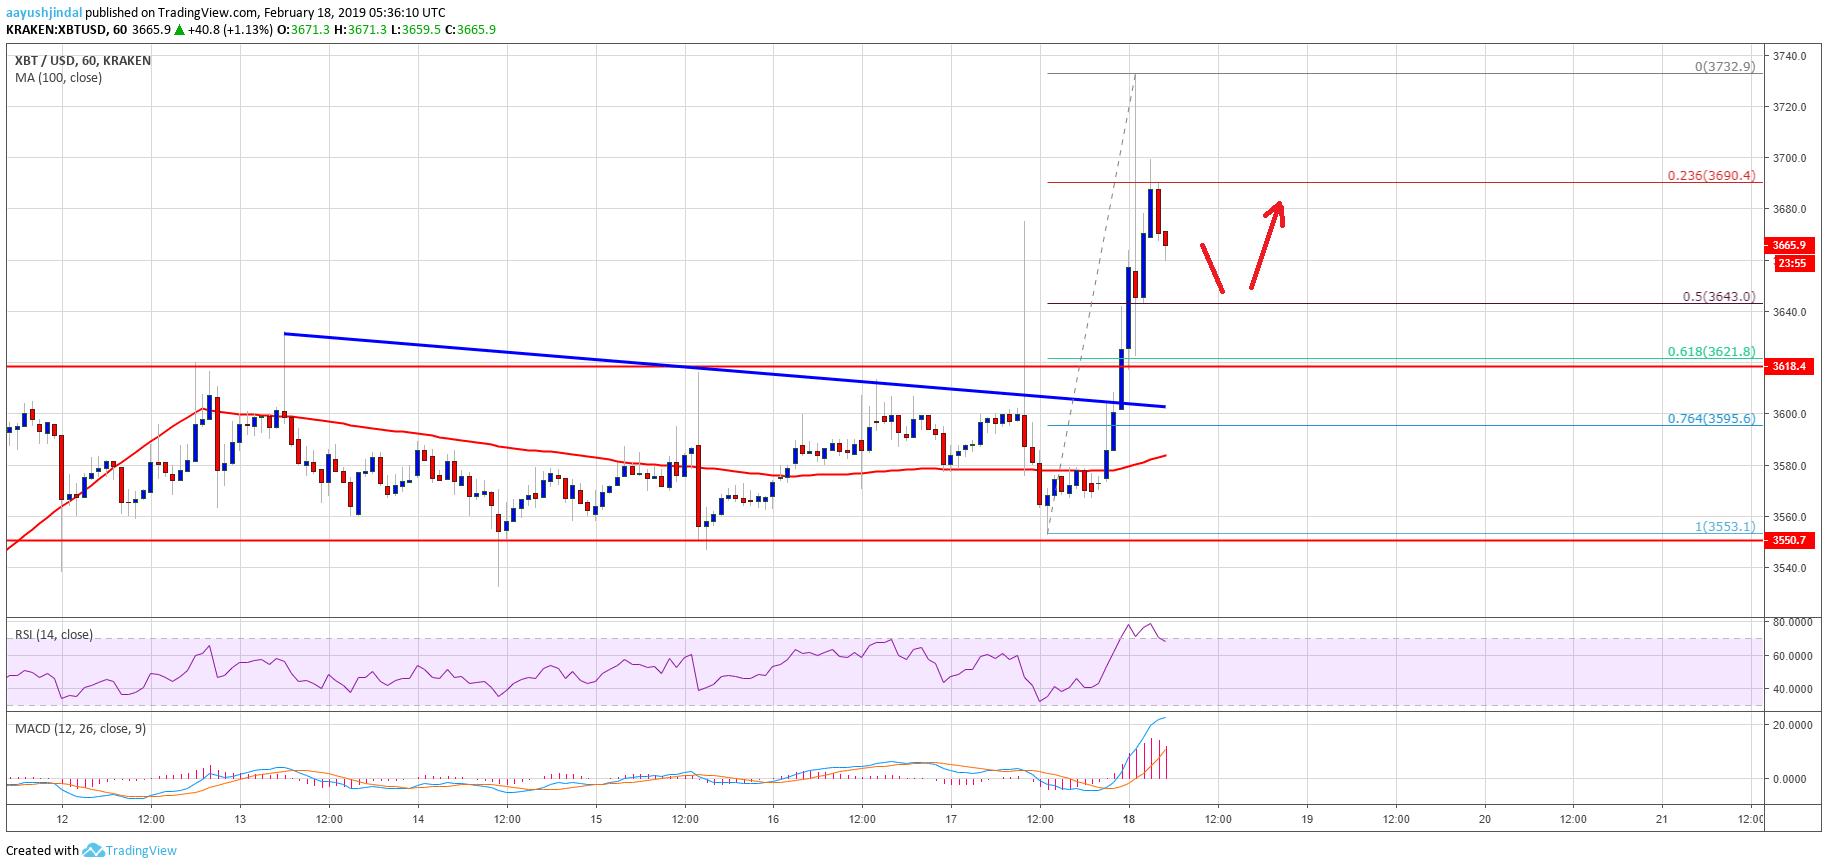
- Bitcoin price formed a strong support near the $3,550 level and traded higher against the US Dollar.
- There was a break above a major bearish trend line with resistance at $3,610 on the hourly chart of the BTC/USD pair (data feed from Kraken).
- The pair broke the $3,650 and $3,700 resistance levels to move into a positive zone.
- A high was formed at $3,732 before the price started a downside correction.
Bitcoin price gained traction and broke the key $3,600 resistance against the US Dollar. BTC is now placed nicely in a positive zone and dips remain supported near $3,620 and $3,600.
Bitcoin Price Analysis
There was a brief consolidation this past week above the $3,550 support in bitcoin price against the US Dollar. The BTC/USD pair formed a strong support near the $3,550 level and later traded higher. The price gained traction and broke many resistances, including $3,580 and $3,600. It opened the doors for more gains and the price even settled above $3,600 and the 100 hourly simple moving average. During the upward move, there was a break above a major bearish trend line with resistance at $3,610 on the hourly chart of the BTC/USD pair.
The pair even cleared the $3,700 resistance and traded to a new weekly high at $3,732. Later, there was a downside correction below the $3,700 level. Sellers pushed the price below the 23.6% Fib retracement level of the last wave from the $3,553 low to $3,732 high. However, there are many supports near the $3,640 and $3,620 levels. An initial support is $3,645 and the 50% Fib retracement level of the last wave from the $3,553 low to $3,732 high.
The main support is near the $3,620 level (the previous breakout resistance). It also coincides with the 61.8% Fib retracement level of the last wave from the $3,553 low to $3,732 high. Therefore, if there is a downside correction below $3,660, the price could find support near the $3,640 and $3,620 levels. On the upside, an initial resistance is near the $3,700 level, above which the price may perhaps test $3,750.
Looking at the chart, bitcoin price clearly broke a few important resistances near $3,600 to move into a bullish zone. The current price action is positive, with chances of more gains above $3,700 and $3,750. The next key resistance above $3,750 is near the $3,880 level.
Technical indicators
Hourly MACD – The MACD is placed heavily in the bullish zone, signaling a strong upward move in the short term.
Hourly RSI (Relative Strength Index) – The RSI for BTC/USD is currently retreating from the overbought levels.
Major Support Levels – $3,640 followed by $3,620 and $3,600.
Major Resistance Levels – $3,700, $3,720 and 3,740.