

- Bitcoin price surged and broke the $3,720 and $3,880 resistance levels against the US Dollar.
- The price traded close to the $4,000 resistance level and a new weekly high was formed at $3,955.
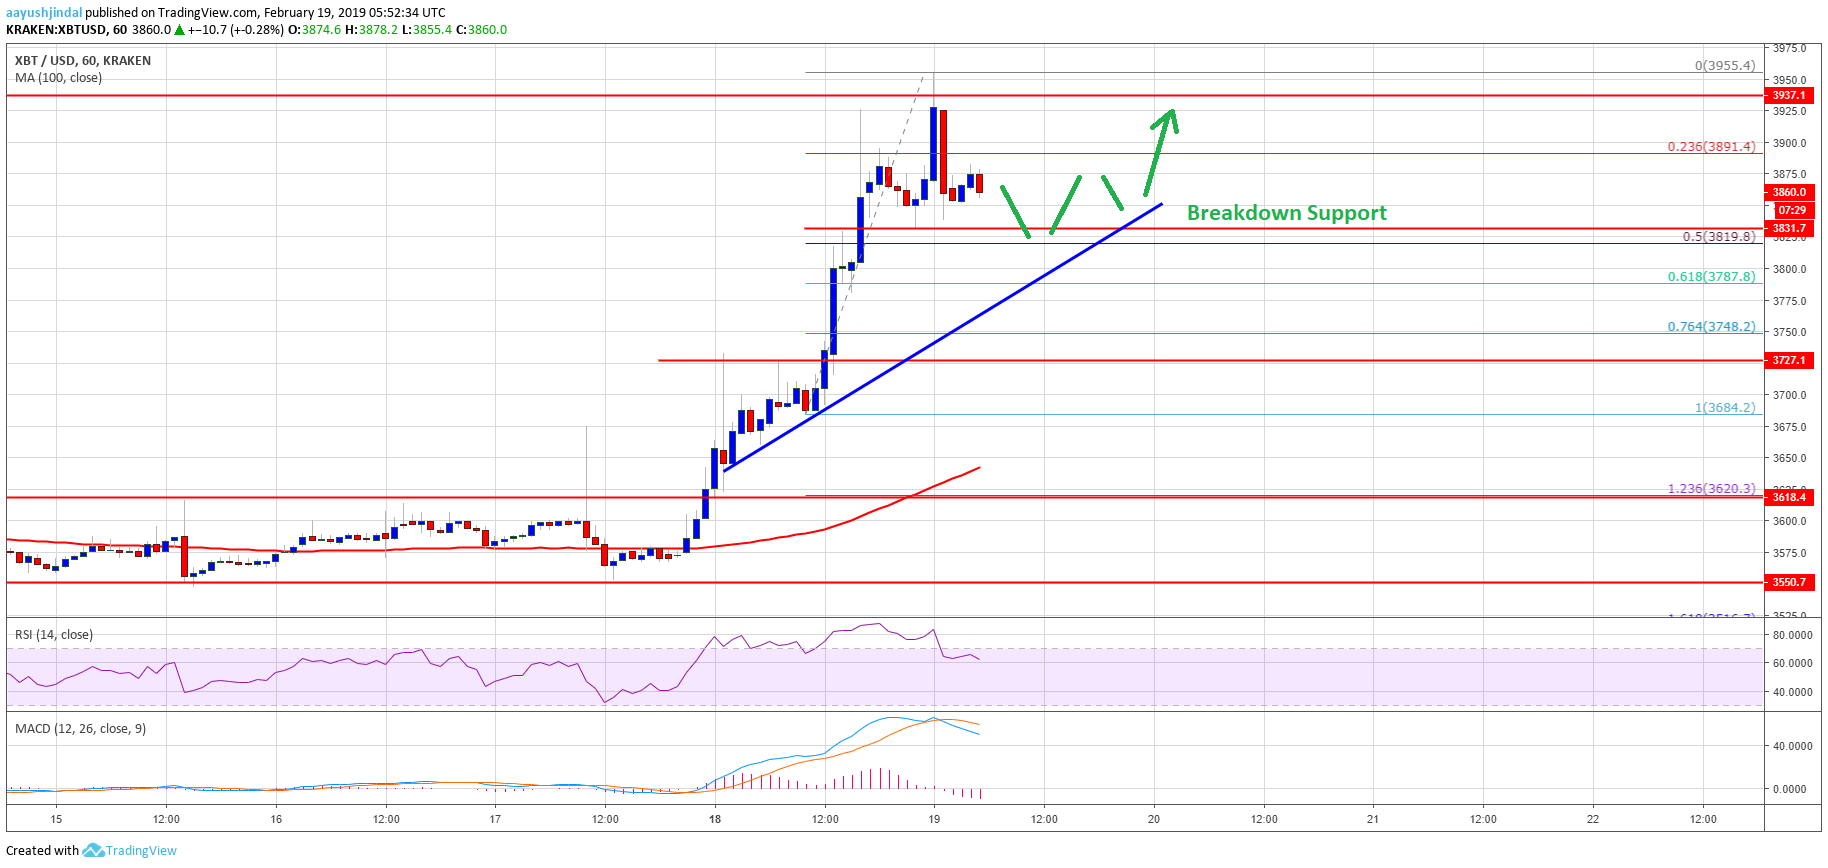
- There is a connecting bullish trend line formed with support at $3,800 on the hourly chart of the BTC/USD pair (data feed from Kraken).
- The pair corrected lower, but dips remain well supported above $3,800 and $3,720.
Bitcoin price rallied above the key $3,800 resistance against the US Dollar. BTC could move into a medium term uptrend if there is a successful daily close above $4,000 and $4,200.
Bitcoin Price Analysis
In the last couple of analysis, we discussed the chances of bitcoin price hitting the $4,000 level against the US Dollar. The BTC/USD pair did gain bullish momentum recently and broke the $3,650 and $3,720 resistance levels. There was a clear bullish break noted above the $3,800 resistance and the 100 hourly simple moving average. The main driving force was Ethereum, which rallied recently towards the $150 resistance level. It helped BTC to climb towards the $4,000 resistance area. A high was formed at $3,955 and later the price started a downside correction.
It declined below the $3,900 support and the 23.6% Fib retracement level of the last wave from the $3,553 low to $3,732 high. Sellers pushed the price towards the $3,840 level (the previous swing low), where buyers emerged. On the downside, there are many supports near the $3,800 level. More importantly, there is a connecting bullish trend line formed with support at $3,800 on the hourly chart of the BTC/USD pair. Besides, the 50% Fib retracement level of the last wave from the $3,553 low to $3,732 high is near the $3,819 level.
If there is a downside break below the $3,800 support, the price could test the $3,720 support level. An intermediate support is $3,750 and the 76.4% Fib retracement level of the last wave from the $3,553 low to $3,732 high. Therefore, dips remain well supported as long as the price stays above the $3,720 pivot level.

Looking at the chart, bitcoin price is placed nicely in an uptrend above $3,800. On the upside, an initial resistance is at $3,950 and $4,000. However, the main resistance is at $4,200, where sellers could emerge. On the positive note, if there is a successful daily close above $4,000 and $4,200, the price is likely to start a medium term uptrend.
Technical indicators
Hourly MACD – The MACD is slowly gaining pace in the bearish zone, but with limited strength.
Hourly RSI (Relative Strength Index) – The RSI for BTC/USD corrected lower, but it is still above the 60 level.
Major Support Level – $3,820 followed by $3,800.
Major Resistance Level – $3,950 and 4,000.