
Reason to trust
How Our News is Made
Strict editorial policy that focuses on accuracy, relevance, and impartiality
Ad discliamer
Morbi pretium leo et nisl aliquam mollis. Quisque arcu lorem, ultricies quis pellentesque nec, ullamcorper eu odio.
- ETH price started a downside correction after testing the $149-150 resistance area against the US Dollar.
- There was a break below a key bullish trend line with support at $146 on the hourly chart of ETH/USD (data feed via Kraken).
- There was an increase in selling pressure and the price tested the $139-140 support area.
- A few important supports are in place near the $141, $140 and $136 levels.
Ethereum price started a short term correction against the US Dollar and bitcoin. ETH/USD must stay above $136 and the 100 hourly simple moving average to bounce back.
Ethereum Price Analysis
In the past few days, ETH price climbed higher and broke the $135 and $140 resistances against the US Dollar. The ETH/USD pair even traded towards the $150 resistance zone, where sellers emerged. A top was formed just below the $150 level and later the price started a downside correction. It declined below the $146 support and the 23.6% Fib retracement level of the last leg from the $135 swing low to $150 swing high. It opened the doors for more gains and the price dropped towards the $140 support zone.
Moreover, there was a break below a key bullish trend line with support at $146 on the hourly chart of ETH/USD. The pair declined below the 50% Fib retracement level of the last leg from the $135 swing low to $150 swing high. However, there are many important supports are in place near the $141, $140 and $136 levels. The main support is near the $138 level. It coincides with the 76.4% Fib retracement level of the last leg from the $135 swing low to $150 swing high. Besides, the 100 hourly simple moving average is positioned near the $136 level to act as a strong support.
Therefore, if the price continues to decline, the $138 and $136 levels are likely to prevent losses. If there is a break and close below the 100 hourly SMA, the price might decline further towards the $130 level. On the other hand, if the price finds support near $138, it could start a fresh upward move.
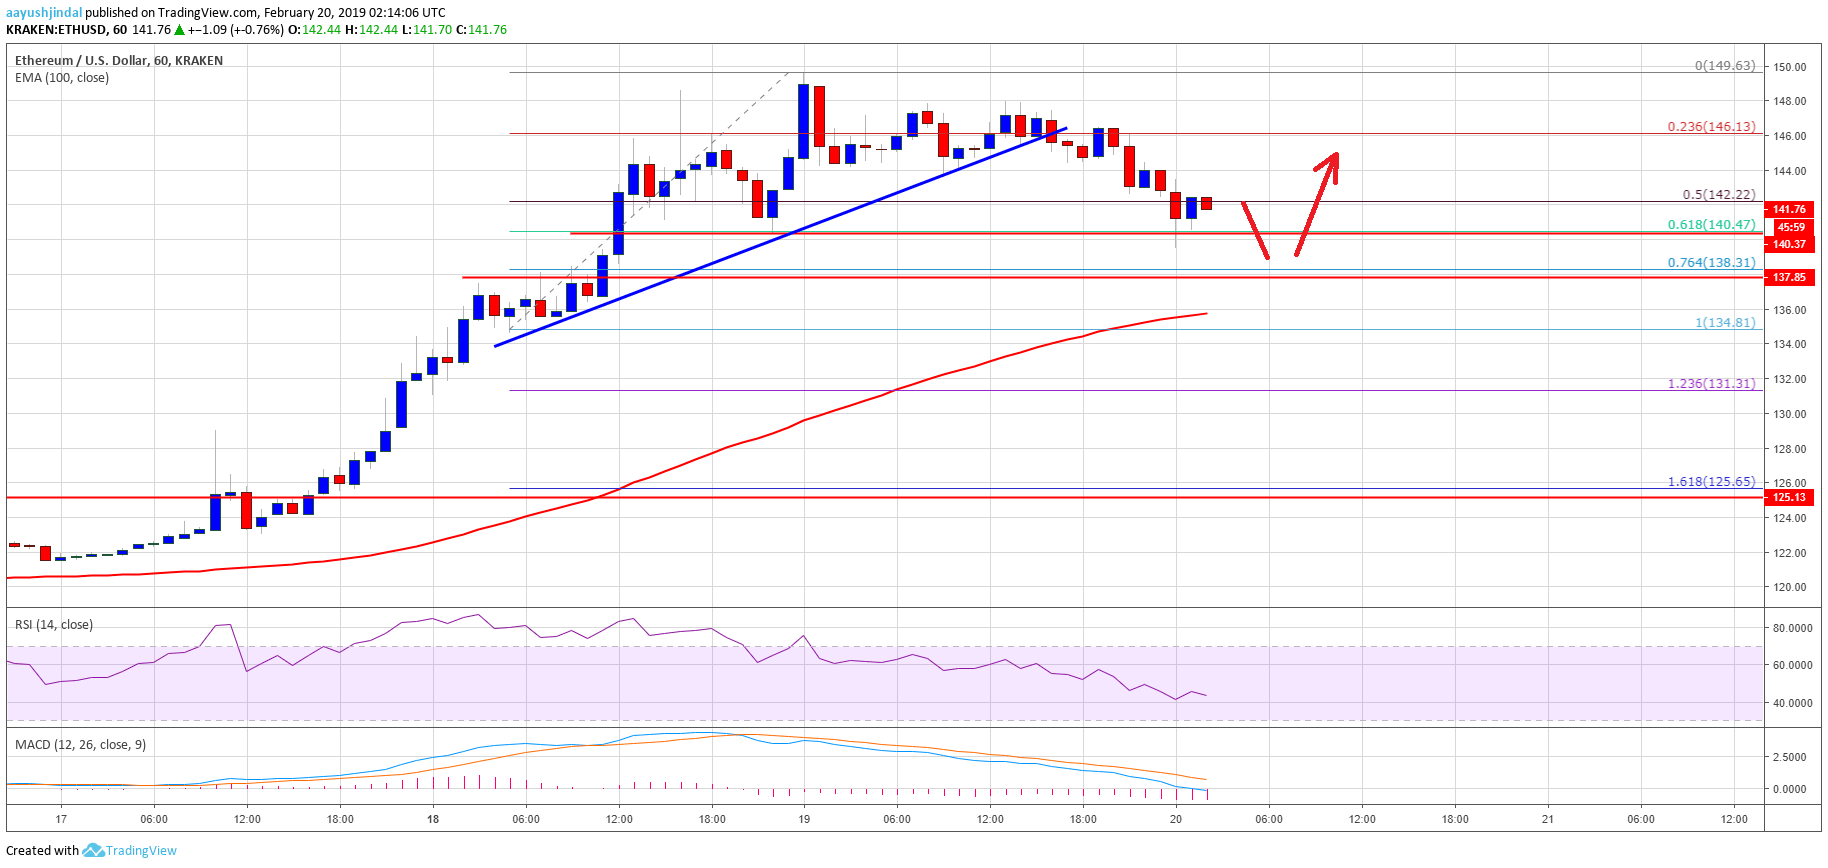
Looking at the chart, ETH price corrected lower from the $150 resistance zone. However, dips remain supported as long as the price is above the $136 pivot zone. On the upside, an initial resistance is near $145, above which the price may retest $150.
ETH Technical Indicators
Hourly MACD – The MACD for ETH/USD moved back in the bearish zone, with a few bearish signs.
Hourly RSI – The RSI for ETH/USD is now just below the 50 level, with a bearish angle.
Major Support Level – $136
Major Resistance Level – $145


