
Reason to trust
How Our News is Made
Strict editorial policy that focuses on accuracy, relevance, and impartiality
Ad discliamer
Morbi pretium leo et nisl aliquam mollis. Quisque arcu lorem, ultricies quis pellentesque nec, ullamcorper eu odio.
- Ripple price stayed above the key $0.2970 support and bounced back against the US dollar.
- The price gained momentum above the $0.3020 and $0.3030 resistance levels to turn positive.
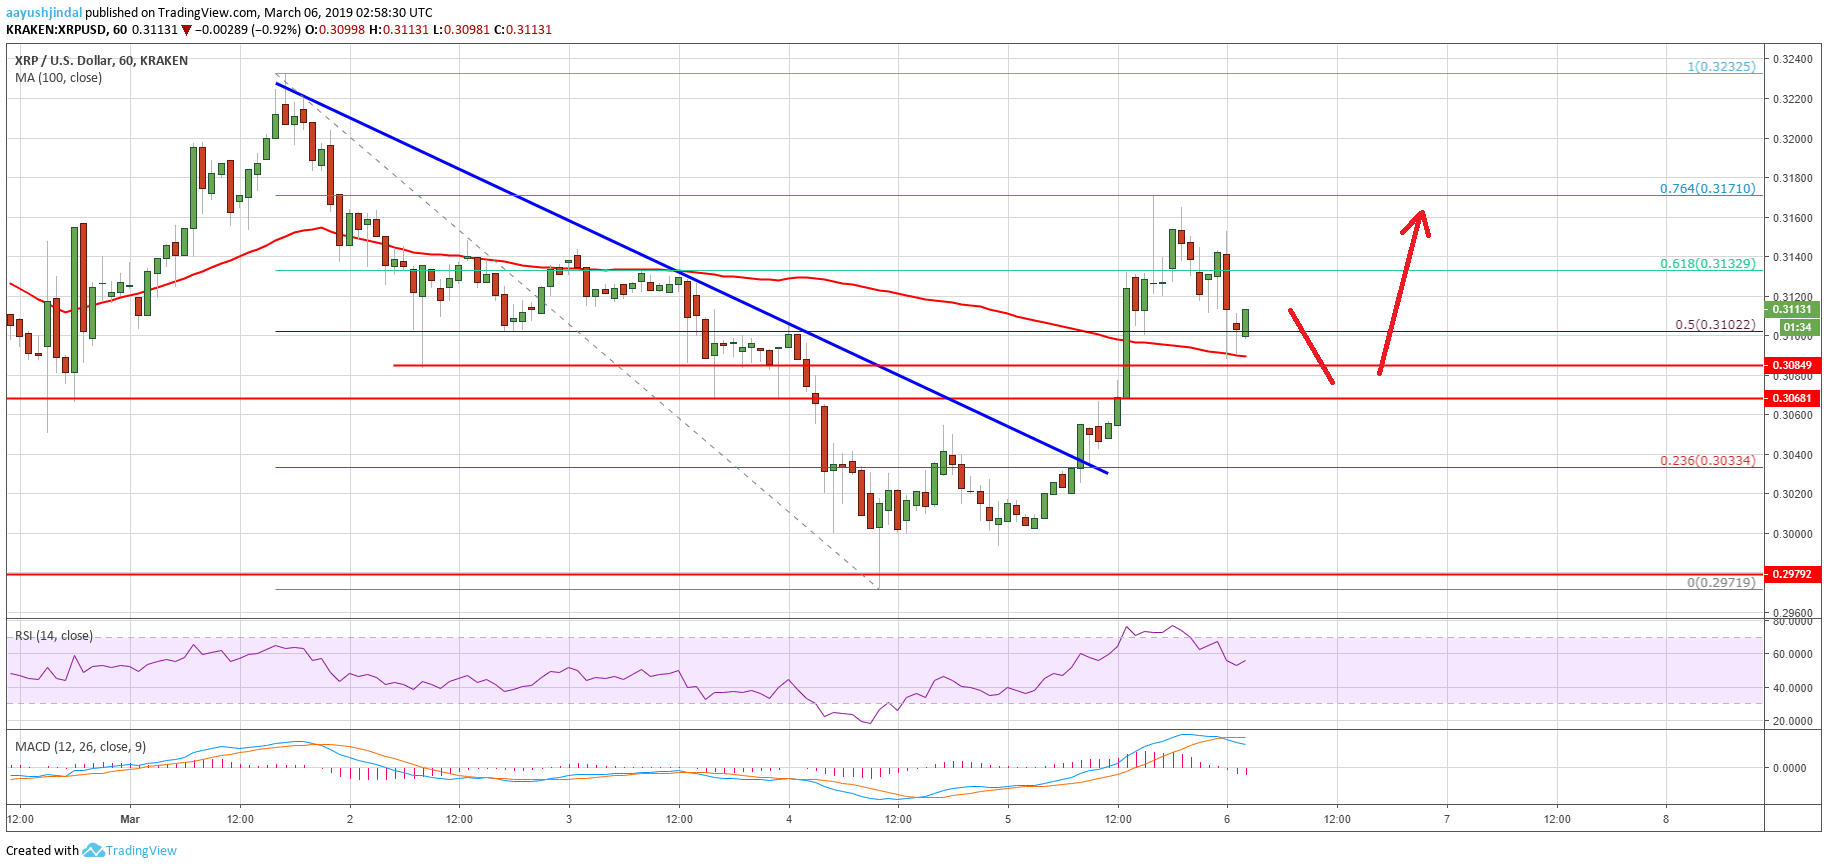
- Yesterday’s highlighted important bearish trend line was breached near $0.3030 on the hourly chart of the XRP/USD pair (data source from Kraken).
- The pair rallied above $0.3080 and $0.3100 before it faced sellers near $0.3170.
Ripple price recovered sharply from lows against the US Dollar and bitcoin. XRP/USD settled above the key $0.3080 resistance, which could now act as a buy zone in the near term.
Ripple Price Analysis
Yesterday, there was a downside reaction in ripple price below the $0.3000 support against the US Dollar. The XRP/USD pair tested the $0.2970 support, where buyers emerged. Later, the price recovered above $0.3000 and started consolidating losses. Finally, sellers failed to push the price to a new intraday low, resulting in bullish moves above $0.3020. There was a sharp upward move and the price broke the $0.3030 resistance level.
During the upward move, yesterday’s highlighted important bearish trend line was breached near $0.3030 on the hourly chart of the XRP/USD pair. The pair even broke the 61.8% Fib retracement level of the last decline from the $0.3232 high to $0.2970 swing low. More importantly, there was a close above the $0.3080 resistance and the 100 hourly simple moving average. Finally, there was a break above the $0.3150 resistance before sellers emerged near the $0.3170 level.
The 76.4% Fib retracement level of the last decline from the $0.3232 high to $0.2970 swing low acted as a resistance. The price is currently correcting lower and trading below $0.3150. There is a strong support placed near the $0.3080 level and the 100 hourly simple moving average. The next key support is at $0.3068, below which the price could move back into the bearish zone. If the 100 hourly SMA holds, the price is likely to bounce back above $0.3150. A clear break above the $0.3170 resistance may perhaps push the price towards the $0.3200 and $0.3220 resistance levels.
Looking at the chart, ripple price climbed above key resistances near $0.3080, which are now likely to act as supports. However, buyers need to be active above $0.3080 and push the price above $0.3150. If they struggle, there is a risk of a fresh decline below $0.3080 in the near term.
Technical Indicators
Hourly MACD – The MACD for XRP/USD moved back in the bearish zone, but with lack in momentum.
Hourly RSI (Relative Strength Index) – The RSI for XRP/USD corrected lower from 75 and it recently tested the 50 level.
Major Support Levels – $0.3080, $0.3068 and $0.3030.
Major Resistance Levels – $0.3150, $0.3170 and $0.3200.


