
Reason to trust
How Our News is Made
Strict editorial policy that focuses on accuracy, relevance, and impartiality
Ad discliamer
Morbi pretium leo et nisl aliquam mollis. Quisque arcu lorem, ultricies quis pellentesque nec, ullamcorper eu odio.
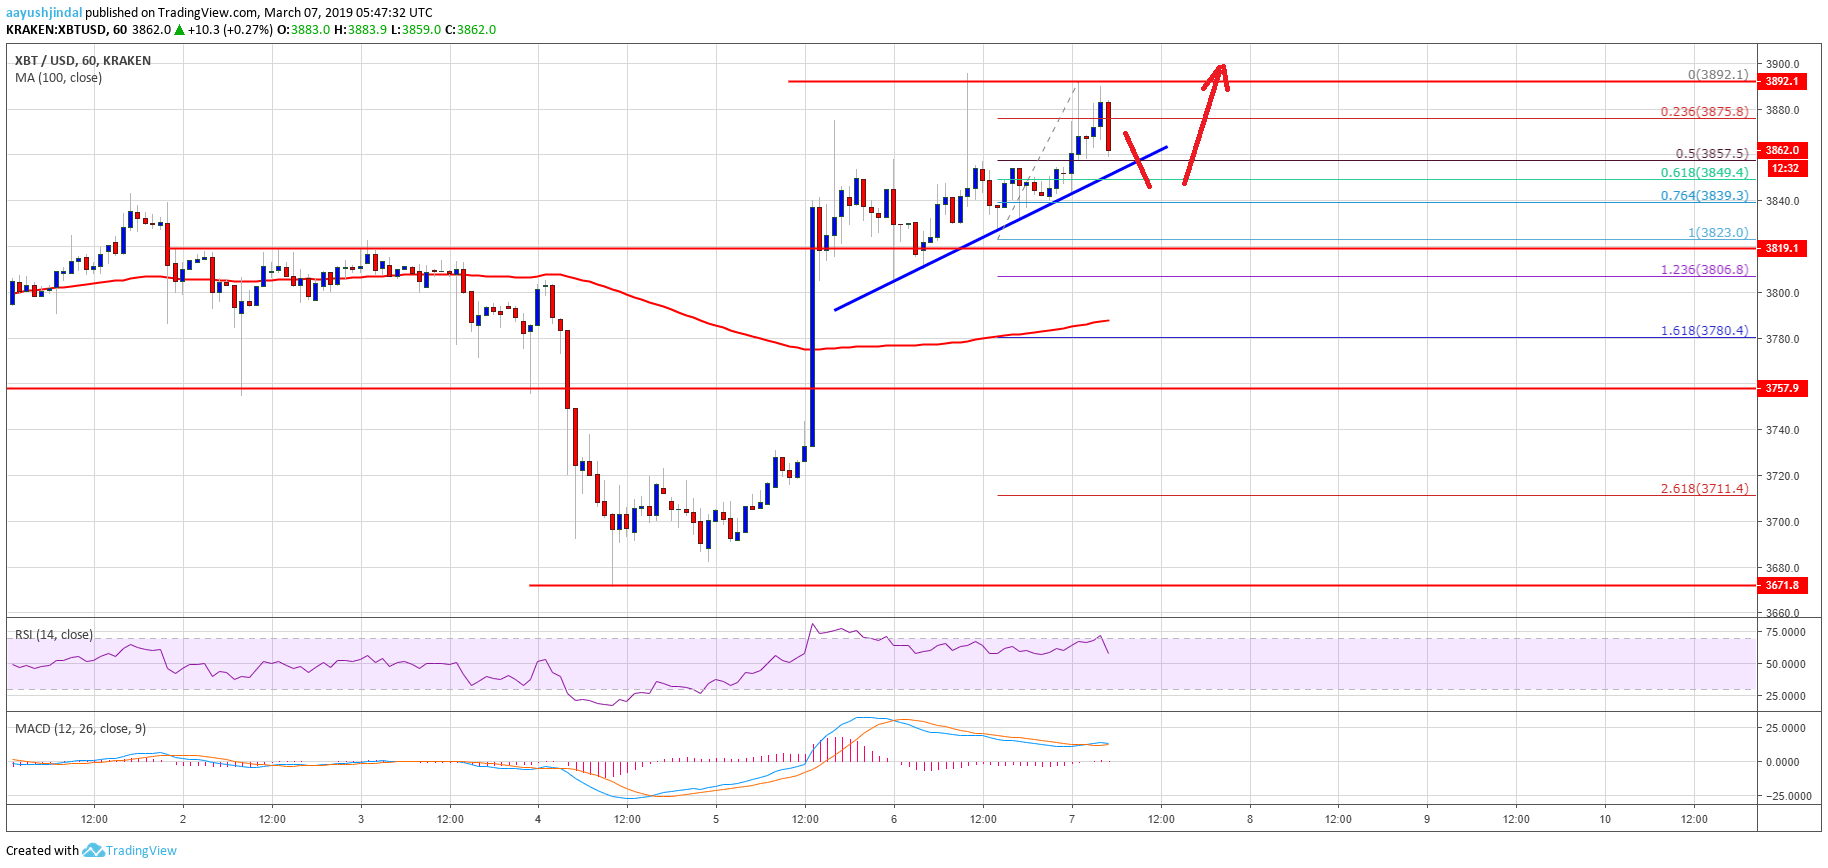
- Bitcoin price broke the key $3,860 resistance and traded to a new weekly high against the US Dollar.
- The price is losing bullish momentum, but it is likely to continue above $3,900 and $3,940.
- There is a key bullish trend line formed with support at $3,850 on the hourly chart of the BTC/USD pair (data feed from Kraken).
- The pair must break the $3,890 and $3,900 resistance levels to continue higher in the near term.
Bitcoin price climbed higher slowly above $3,840 and $3,860 against the US Dollar. BTC could continue higher towards the $4,200 resistance, with supports at 3,820 and $3,760.
Bitcoin Price Analysis
In the past two days, there was a solid comeback by bitcoin price above the $3,760 resistance against the US Dollar. The BTC/USD pair followed a bullish structure and broke the $3,820 resistance level. There was even a close above the $3,800 level and the 100 hourly simple moving average. Later, there were a couple of rejections near the all-important $3,860 resistance. Finally, buyers gained momentum and pushed the price above the $3,860 resistance. A new weekly high was formed at $3,892 and the price is currently placed nicely in an uptrend.
It recently corrected below $3,880 and the 23.6% Fib retracement level of the recent rise from the $3,823 low to $3,892 high. However, there is a good support forming near the $3,850 level. It coincides with the 50% Fib retracement level of the recent rise from the $3,823 low to $3,892 high. More importantly, there is a key bullish trend line formed with support at $3,850 on the hourly chart of the BTC/USD pair. If there is a downside break below the trend line, the price could test the $3,820 support level.
On the other hand, if the price clears the $3,890 and $3,900 resistance levels, there are high chances of more gains. The next key target for buyers could be $4,000, above which the gates could open for a test of $4,200. An intermediate resistance is near the $4,120 level.
Looking at the chart, bitcoin price is staging for more gains above the $3,900 resistance. Having said that, there could be a short-term downside correction below $3,850. In the stated case, the price must hold the $3,780 level and the 100 hourly SMA. If it fails, there are possibilities of a trend change and the price could decline to $3,700.
Technical indicators
Hourly MACD – The MACD is showing positive signs for a move into the bullish zone.
Hourly RSI (Relative Strength Index) – The RSI for BTC/USD tested the 70 level and it is currently correcting lower.
Major Support Level – $3,850 followed by $3,820.
Major Resistance Level – $3,890, $3,900 and 3,980.


