Reason to trust
How Our News is Made
Strict editorial policy that focuses on accuracy, relevance, and impartiality
Ad discliamer
Morbi pretium leo et nisl aliquam mollis. Quisque arcu lorem, ultricies quis pellentesque nec, ullamcorper eu odio.
- Bitcoin price failed to hold the key $3,860 support and traded lower against the US Dollar.
- The price even broke the $3,840 support and settled well below the 100 hourly simple moving average.
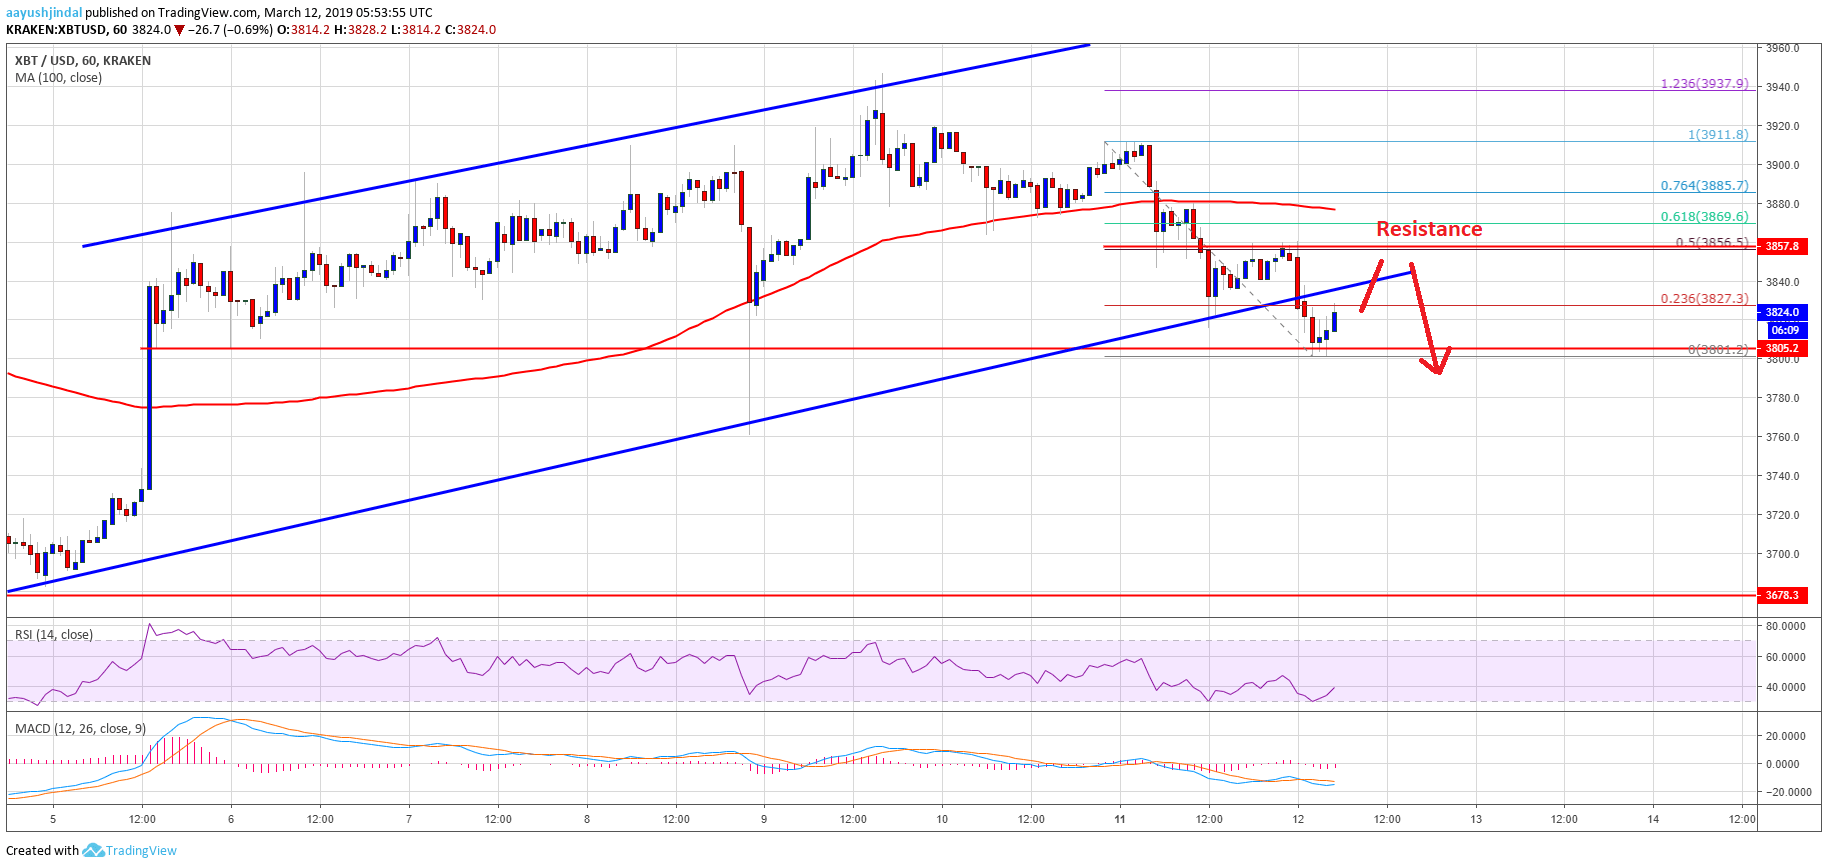
- There was a break below a crucial ascending channel with support at $3,830 on the hourly chart of the BTC/USD pair (data feed from Kraken).
- The pair could accelerate declines if there is a break below the $3,800 support area.
Bitcoin price is under pressure below the $3,860 support against the US Dollar. BTC could reverse gains if sellers succeed in pushing the price below the $3,800 and $3,780 supports.
Bitcoin Price Analysis (BTC to USD)
After trading to a new monthly high at $3,940, bitcoin price started a fresh decline against the US Dollar. The BTC/USD pair traded below the $3,900 and $3,860 supports to enter a short term bearish zone. There was also a close below the $3,860 support and the 100 hourly simple moving average. The price traded below the 61.8% Fib retracement level of the last leg from the $3,761 low to $3,940 swing high. It opened the doors for more losses below the $3,840 support.
More importantly, there was a break below a crucial ascending channel with support at $3,830 on the hourly chart of the BTC/USD pair. The pair extended losses and tested the $3,800 support level. At the moment, it is consolidating losses above the $3,800 support. An initial resistance is near the 23.6% Fib retracement level of the recent decline from the $3,911 high to $3,801 low. However, the main resistance is near the broken channel and the $3,860 level. Besides, the 50% Fib retracement level of the recent decline from the $3,911 high to $3,801 low is also near $3,856.
Therefore, if there is an upside correction, the price is likely to face a strong resistance near the $3,860 level. The next key resistance is near the $3,880 level and the 100 hourly SMA. On the downside, a break below the $3,800 support could open the doors for more losses. The next immediate support is at $3,780, below which the price could tumble towards the $3,700 level.
Looking at the chart, bitcoin price is slowly moving into the bearish zone, with a close below $3,860. If the price fails to move above $3,880 and $3,900, it is likely to extend losses below the $3,805 support in the near term.
Technical indicators:
Hourly MACD – The MACD is placed in the bearish zone, with a negative bias.
Hourly RSI (Relative Strength Index) – The RSI for BTC/USD moved below the 40 level, with a bearish angle.
Major Support Levels – $3,800 followed by $3,780.
Major Resistance Levels – $3,860, $3,880 and $3,900.