
Reason to trust
How Our News is Made
Strict editorial policy that focuses on accuracy, relevance, and impartiality
Ad discliamer
Morbi pretium leo et nisl aliquam mollis. Quisque arcu lorem, ultricies quis pellentesque nec, ullamcorper eu odio.
- Ripple price is under pressure below the $0.3150 and $0.3200 resistance levels against the US dollar.
- The price is struggling to stay above the $0.3100 support and it could decline sharply.
- There is a major bearish trend line in place with resistance at $0.3140 on the hourly chart of the XRP/USD pair (data source from Kraken).
- The pair could decline sharply once there is a break below the $0.3110 and $0.3100 support levels.
Ripple price seems to be moving into a bearish zone against the US Dollar and bitcoin. XRP/USD is likely to revisit the $0.3000 support before it could start a solid rebound.
Ripple Price Analysis
Recently, we saw a slow and steady downside correction in ripple price from the $0.3200 resistance against the US Dollar. The XRP/USD pair declined below the $0.3180 and $0.3150 support levels to move into a short term bearish zone. There was also a close below the $0.3150 support and the 100 hourly simple moving average. The recent decline found support near the $0.3100 level and later the price started an upside correction.
The price recovered above the $0.3120 level and the 50% Fib retracement level of the recent decline from the $0.3182 high to $0.3103 low. There was a push above the $0.3135 level, but the price faced a strong resistance near the $0.3150 level. The stated $0.3150 level was a support earlier and now it is acting as a resistance. Besides, the price failed to clear the 61.8% Fib retracement level of the recent decline from the $0.3182 high to $0.3103 low.
More importantly, there is a major bearish trend line in place with resistance at $0.3140 on the hourly chart of the XRP/USD pair. The trend line is close to the $0.3150 resistance and the 100 hourly SMA. Therefore, it won’t be easy for buyers to clear the $0.3140 and $0.3150 resistance levels. If they succeed, the price may grind higher towards the $0.3200 resistance area. On the other hand, a continuous failure to clear the $0.3150 resistance could result in a sharp decline.
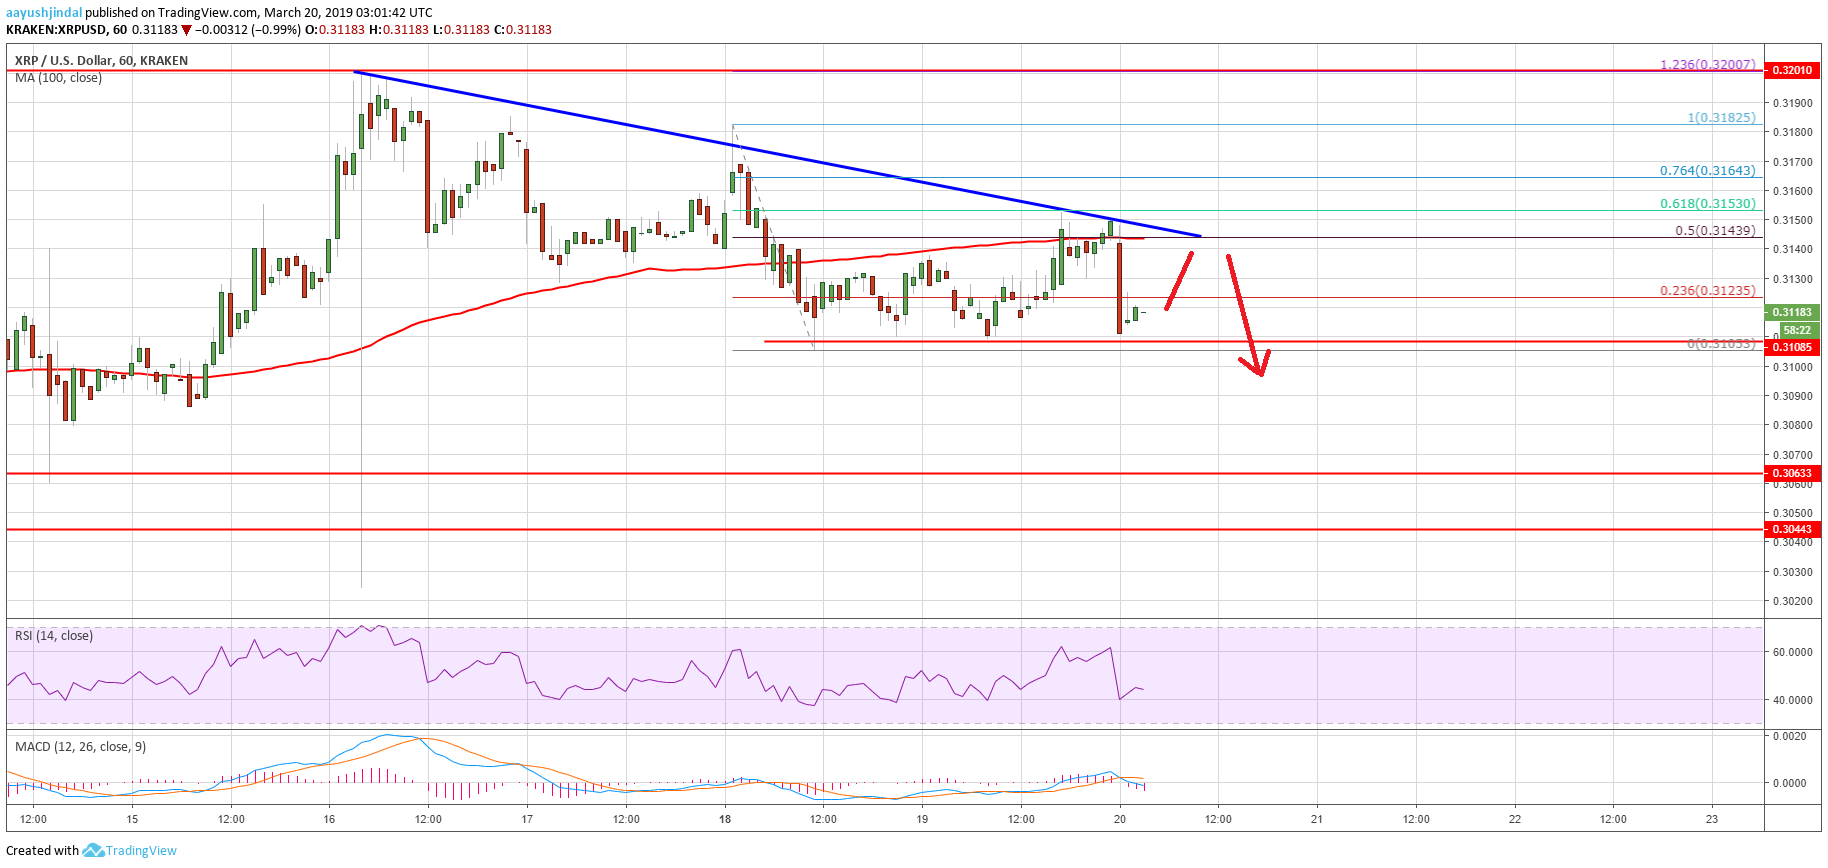
Looking at the chart, ripple price seems to be positioning for a fresh drop below the $0.3100 support level. Once there is a clear break below $0.3100, the price is likely to drop towards the $0.3065 support, followed by $0.3040. However, in the mentioned case, the price is likely to revisit the key $0.3000 support area.
Technical Indicators
Hourly MACD – The MACD for XRP/USD is currently gaining momentum in the bearish zone.
Hourly RSI (Relative Strength Index) – The RSI for XRP/USD dipped below the 50 level and it is currently near 40.
Major Support Levels – $0.3100, $0.3065 and $0.3040.
Major Resistance Levels – $0.3140, $0.3150 and $0.3200.


