Reason to trust
How Our News is Made
Strict editorial policy that focuses on accuracy, relevance, and impartiality
Ad discliamer
Morbi pretium leo et nisl aliquam mollis. Quisque arcu lorem, ultricies quis pellentesque nec, ullamcorper eu odio.
- Ripple price is trading in a positive zone above the $0.3500 support area against the US dollar.
- Bitcoin and Ethereum climbed higher recently above the $5,200 and $180 levels respectively.
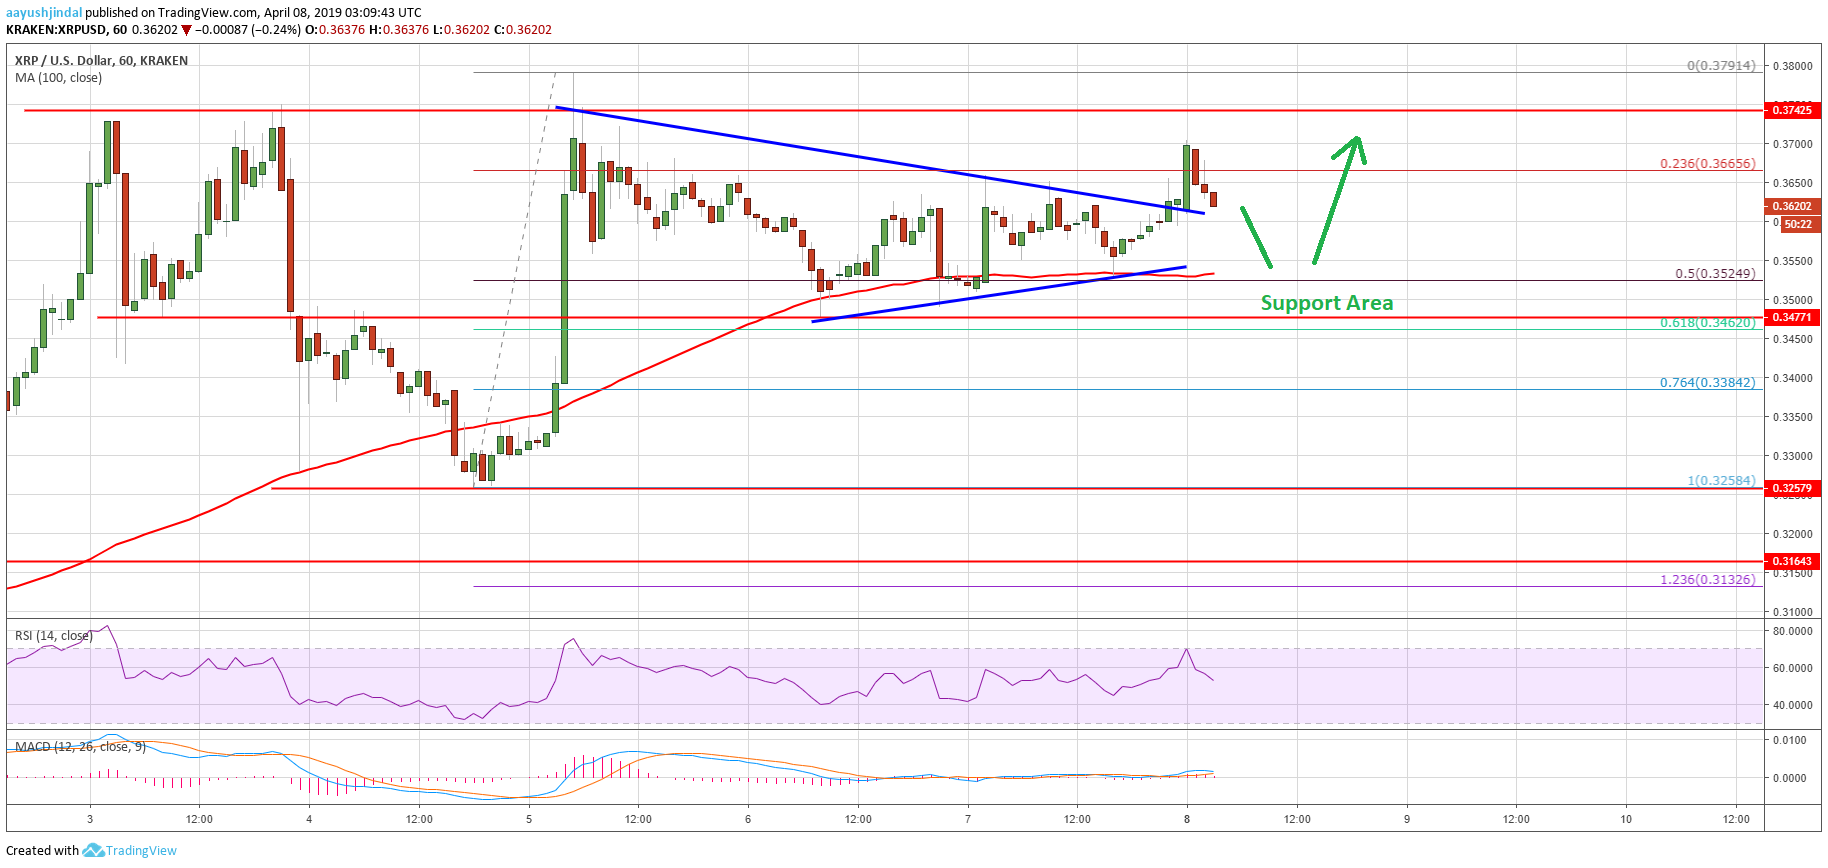
- There was a break above a short-term contracting triangle with resistance near $0.3620 on the hourly chart of the XRP/USD pair (data source from Kraken).
- The pair must clear the $0.3750 resistance to climb towards the $0.3850 and $0.4000 resistances.
Ripple price is placed nicely for more gains against the US Dollar and bitcoin. XRP might sooner or later break the $0.3750 resistance to start a solid rise towards the $0.4000 level.
Ripple Price Analysis
After a downside correction, ripple price found support near the $0.3250 level against the US Dollar. The XRP/USD pair started a fresh rise and traded above the $0.3380 and $0.3400 resistance levels. Later, there was a close above the $0.3500 level and the 100 hourly simple moving average. A swing high was formed at $0.3791 before the price corrected once again. It declined below the $0.3600 level and the 50% Fib retracement level of the last wave from the $0.3258 low to $0.3791 high.
However, the $0.3500 level acted as a solid support along with the 100 hourly SMA. Besides, the 61.8% Fib retracement level of the last wave from the $0.3258 low to $0.3791 high also acted as a support. The price is currently moving higher and is placed above the $0.3600 level. Moreover, there was a break above a short-term contracting triangle with resistance near $0.3620 on the hourly chart of the XRP/USD pair. The pair tested the $0.3700 level and it is currently signaling more gains.
On the upside, the main resistance is near the $0.3750 and $0.3780 levels. A successful close above the $0.3750 level is likely to open the doors for more gains above the $0.3850 resistance. The next main hurdle for buyers is near the $0.4000 level, where sellers are likely to appear.
Looking at the chart, ripple price is clearly trading in a bullish zone above the $0.3600 and $0.3550 support levels. Therefore, if there is a fresh downside correction, buyers are likely to protect $0.3550 and the 100 hourly SMA. On the upside, sellers need to keep an eye on $0.3750 and $0.3780. A successful follow through above $0.3780 and $0.3800 is likely to push the price towards the $0.3850, $0.3900 or even $0.4000.
Technical Indicators
Hourly MACD – The MACD for XRP/USD is placed nicely in the bullish zone.
Hourly RSI (Relative Strength Index) – The RSI for XRP/USD is currently correcting lower towards the 50 level.
Major Support Levels – $0.3600, $0.3550 and $0.3520.
Major Resistance Levels – $0.3700, $0.3750 and $0.3780.