

- Bitcoin price settled above the $5,160 resistance and climbed above $5,250 against the US Dollar.
- The price traded towards the $5,300 resistance and it is currently consolidating gains.
- There is a key ascending channel in place with support at $5,230 on the hourly chart of the BTC/USD pair (data feed from Kraken).
- The pair could dips a few points, but it remains well supported for more gains above $5,300 and $5,350.
Bitcoin price gained bullish momentum above $5,250 against the US Dollar. BTC remains in an uptrend and it is likely to climb above $5,400 or even $5,450 in the near term.
Bitcoin Price Analysis
In the past three sessions, there were positive moves above $5,160 in bitcoin price against the US Dollar. After yesterday’s positive close above the $5,160 resistance, BTC/USD gained strength. There was a minor downside correction from the $5,275 swing high, but dips remained supported. The previous important resistances near $5,180 and $5,160 acted as strong supports. The price also stayed above the 50% Fib retracement level of the last leg from the $4,942 low to $5,275 high.
Later, the price started a fresh increase and broke the $5,250 and $5,275 resistance levels. It tested the $5,300 level on two occasions and it is currently consolidating gains. An initial support is near the 23.6% Fib retracement level of the recent upward move from the $5,017 low to $5,300 high. There is also a key ascending channel in place with support at $5,230 on the hourly chart of the BTC/USD pair. If the pair fails to hold the channel support, it could decline towards the $5,180 support area.
The main support is at $5,160, and the 50% Fib retracement level of the recent upward move from the $5,017 low to $5,300 high. There is also a major bullish trend line in place with support near $5,160 on the same chart. Overall, bitcoin remains well supported above $5,160 and 100 hourly simple moving average. On the upside, an initial resistance is near the $5,300 level. A break above $5,300 and $5,320 could accelerate gains in the near term.
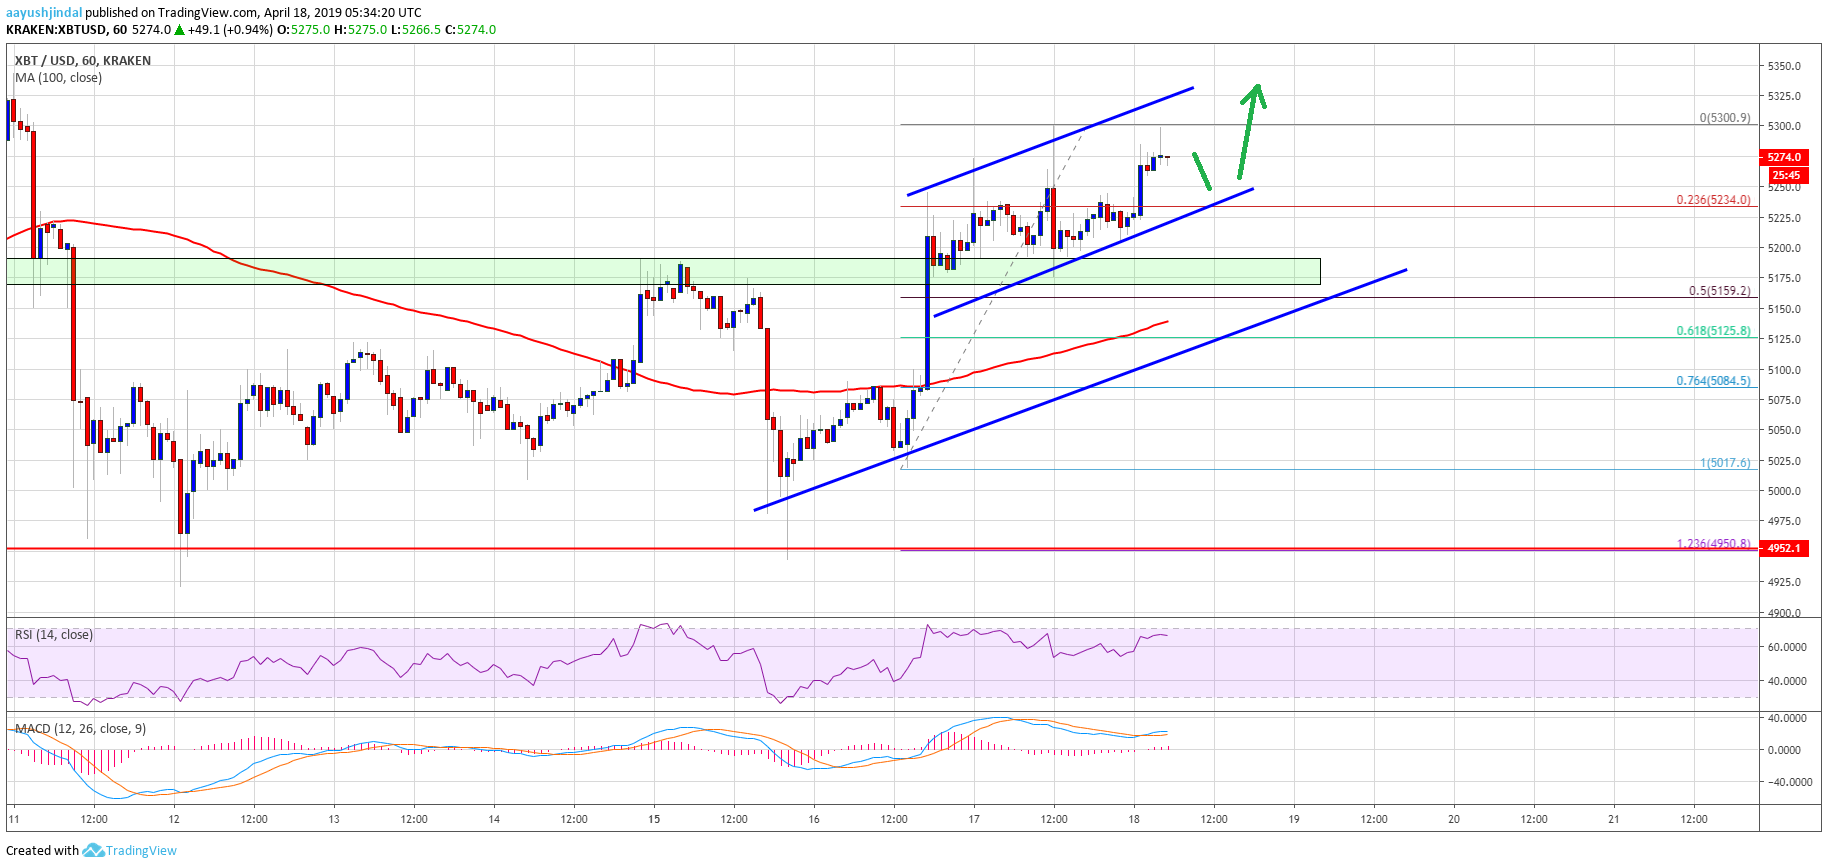

Looking at the chart, bitcoin price gained bullish momentum above $5,200 and tested $5,300. In the short term, there could be a minor downside correction towards $5,230 or $5,200. However, the price is likely to bounce back and trade past $5,300, $5,320 and $5,350 resistance levels.
Technical indicators:
Hourly MACD – The MACD is slowly reducing its bullish slope.
Hourly RSI (Relative Strength Index) – The RSI for BTC/USD is currently correcting from the 65 level and could test the 55 level.
Major Support Levels – $5,200 followed by $5,160.
Major Resistance Levels – $5,300, $5,350 and $5,400.