
Reason to trust
How Our News is Made
Strict editorial policy that focuses on accuracy, relevance, and impartiality
Ad discliamer
Morbi pretium leo et nisl aliquam mollis. Quisque arcu lorem, ultricies quis pellentesque nec, ullamcorper eu odio.
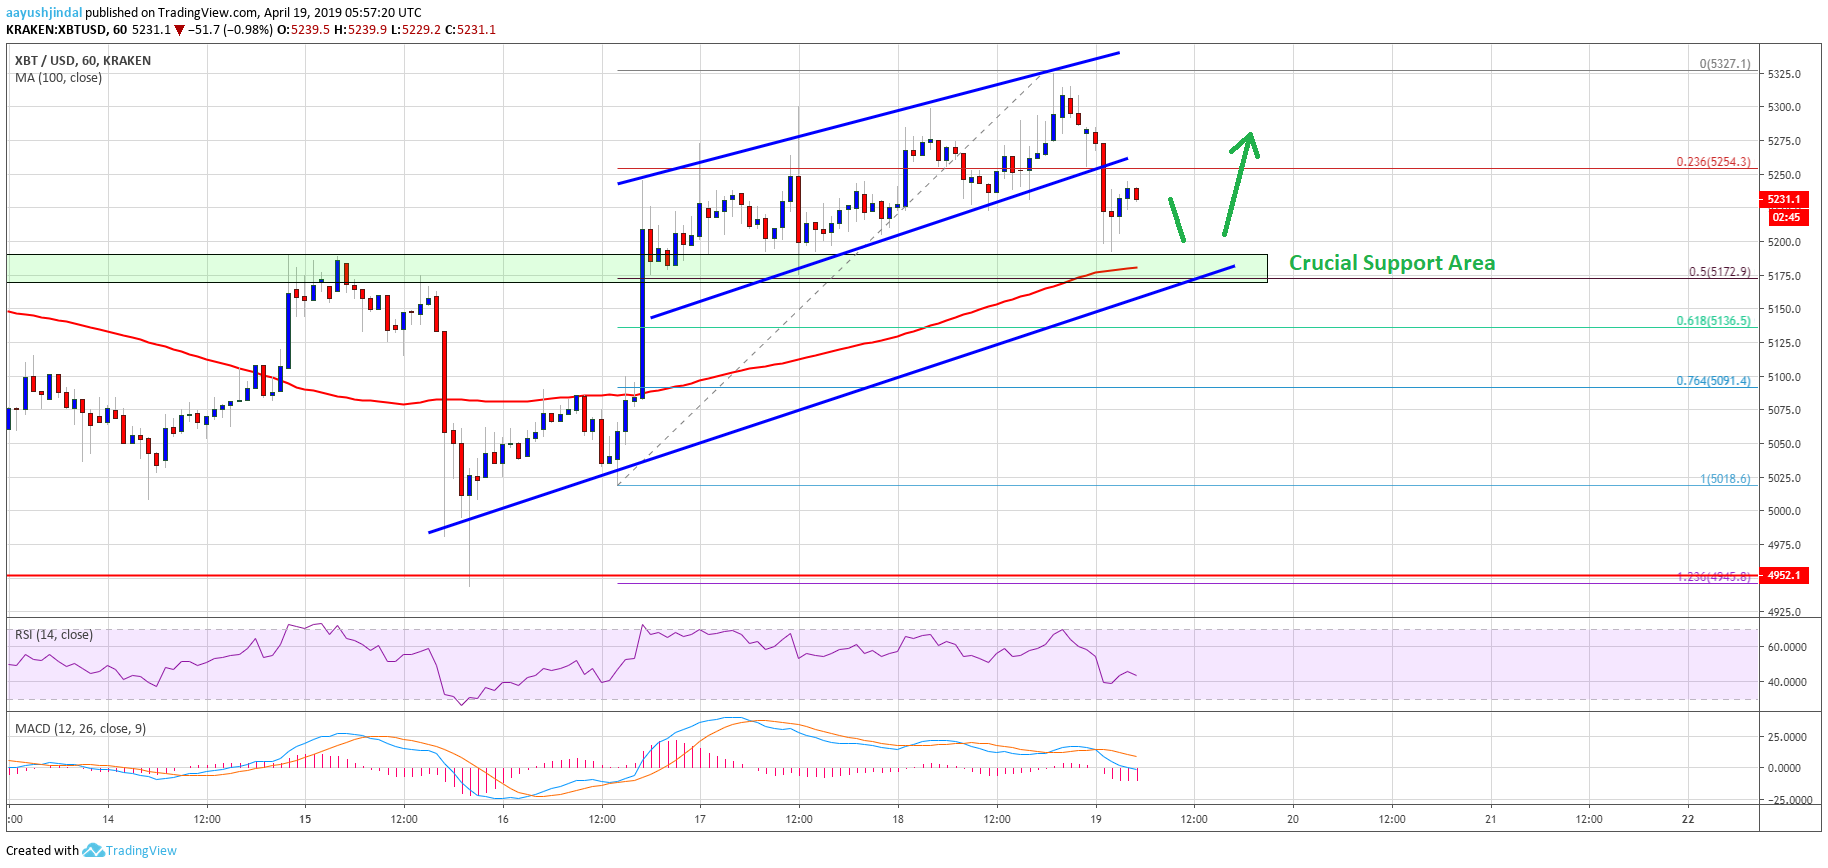
- Bitcoin price climbed further above $5,300 before topping near the $5,330 level against the US Dollar.
- The price corrected lower below $5,300 and $5,255 support levels.
- There was a break below yesterday’s discussed ascending channel with support at $5,250 on the hourly chart of the BTC/USD pair (data feed from Kraken).
- The pair is still trading nicely above the key $5,180 and $5,160 support levels.
Bitcoin price corrected lower towards key supports against the US Dollar. BTC is likely to bounce back above $5,300 as long as it is trading above the $5,160 support area.
Bitcoin Price Analysis
Yesterday, we saw a steady rise above $5,260 and $5,280 in bitcoin price against the US Dollar. The BTC/USD pair even broke the $5,300 resistance and traded close to the $5,330 level. A new weekly high was formed at $5,327 before the price started a downside correction. There was a break below the $5,260 support, and the 23.6% Fib retracement level of the recent wave from the $5,018 low to $5,327 high.
Besides, there was a break below yesterday’s discussed ascending channel with support at $5,250 on the hourly chart of the BTC/USD pair. The pair traded close the $5,200 support before buyers appeared. On the downside, there is a strong support forming near $5,180 and the 100 hourly simple moving average. The 50% Fib retracement level of the recent wave from the $5,018 low to $5,327 high is also near the $5,170 level to act as a support. More importantly, there is a crucial bullish trend line in place with support at $5,170 on the same chart.
Therefore, bitcoin remains well supported above the $5,170 and $5,180 levels. Only a close below the $5,160 level and 100 hourly simple moving average could start a major decline in the near term. The next support is at $5,090, which is close to the 76.4% Fib retracement level of the same wave. On the upside, the broken channel area near $5,260 could act as a resistance. Above $5,260, the price is likely to surpass the $5,300 and $5,330 levels.
Looking at the chart, bitcoin price is clearly well supported above $5,160 and the 100 hourly simple moving average. Therefore, it is likely to bounce back above $5,300 in the next few hours. Conversely, a convincing close below the $5,160 support level may perhaps trigger an extended drop to $5,090 or $5,020.
Technical indicators:
Hourly MACD – The MACD is likely to move back in the bullish zone.
Hourly RSI (Relative Strength Index) – The RSI for BTC/USD tested the 40 and it is currently moving higher towards 50.
Major Support Levels – $5,200 followed by $5,160.
Major Resistance Levels – $5,260, $5,300 and $5,330.


