
Reason to trust
How Our News is Made
Strict editorial policy that focuses on accuracy, relevance, and impartiality
Ad discliamer
Morbi pretium leo et nisl aliquam mollis. Quisque arcu lorem, ultricies quis pellentesque nec, ullamcorper eu odio.
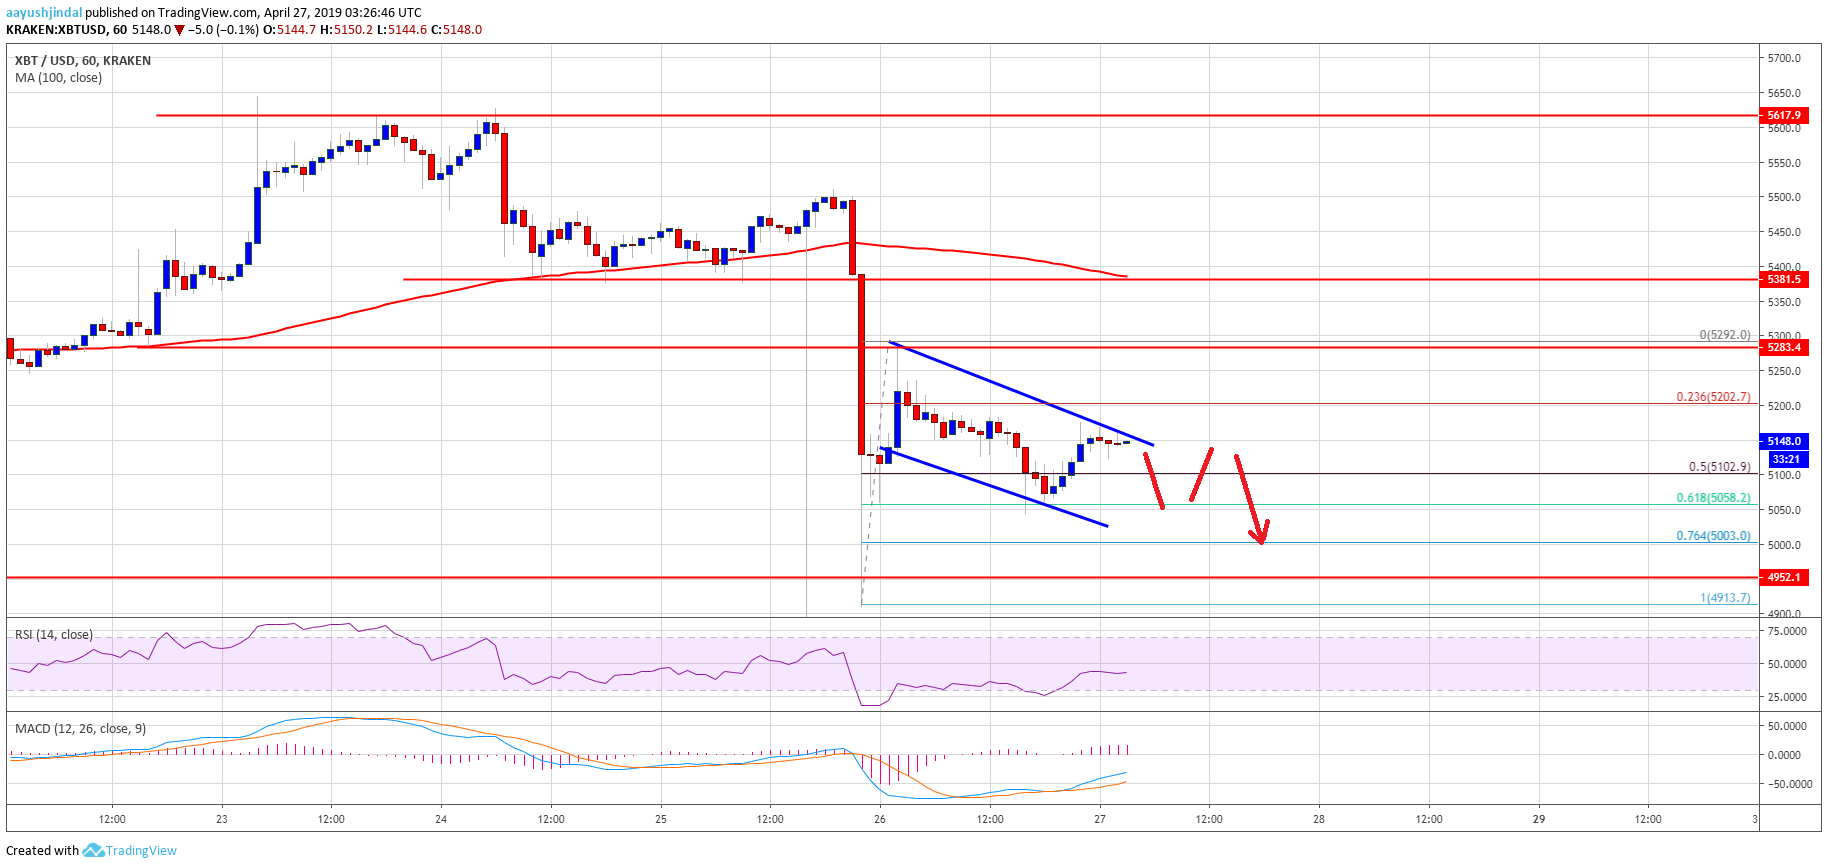
- Bitcoin price settled below the $5,380 and $5,200 support levels against the US Dollar.
- The price is currently under pressure and facing sellers near $5,160 and $5,200.
- There is a short term declining channel forming with resistance near $5,160 on the hourly chart of the BTC/USD pair (data feed from Kraken).
- The pair could struggle to move above $5,200 and it may revisit the $5,050 support area.
Bitcoin price dropped heavily after tether’s drama and settled below $5,380 against the US Dollar. BTC could consolidate in the short term before a fresh decrease to $5,000.
Bitcoin Price Analysis
Yesterday, we saw a sharp decline in bitcoin price below the $5,380 and $5,280 supports against the US Dollar. The BTC/USD pair even broke the $5,200 support and spiked below the $5,000 level. A new swing low was formed near $4,912 and recently the price corrected higher. However, the $5,280 and $5,250 levels acted as hurdles, and the price remained well below the 100 hourly simple moving average. After the price failed to clear $5,280, there was a drop below the $5,200 level.
The price declined below the 50% Fib retracement level of the last wave from the $4,913 swing low to $5,292 high. However, the $5,050 support prevented additional losses and the price recovered recently. Besides, the 61.8% Fib retracement level of the last wave from the $4,913 swing low to $5,292 high acted as a support. At the moment, the price is correcting higher, but facing a lot of hurdles near $5,160, $5,180 and $5,200. There is also a short term declining channel forming with resistance near $5,160 on the hourly chart of the BTC/USD pair.
If there is an upside break above $5,160, the price could test the $5,200 resistance. However, the price must move above the $5,250 and $5,280 levels to start a strong upward move. If it continues to struggle near $5,280, there is a risk of another dip below $5,120 and $5,100 in the near term. The next key support is at $5,050, below which there is a risk of a drop below the $5,000 support.
Looking at the chart, bitcoin price is under a lot of pressure below the $5,280 resistance level. If the bears remain in action for a long time, there is a risk of a sharp decline below the $5,050 and $5,000 support levels. On the upside, a close above $5,280 might push the price towards $5,380.
Technical indicators:
Hourly MACD – The MACD is currently in the bullish zone, with a few negative signs.
Hourly RSI (Relative Strength Index) – The RSI for BTC/USD is currently moving higher towards the 50 level.
Major Support Levels – $5,100 followed by $5,050.
Major Resistance Levels – $5,160, $5,200 and $5,280.


