
Reason to trust
How Our News is Made
Strict editorial policy that focuses on accuracy, relevance, and impartiality
Ad discliamer
Morbi pretium leo et nisl aliquam mollis. Quisque arcu lorem, ultricies quis pellentesque nec, ullamcorper eu odio.
- ETH price formed a support base near the $150 level and recently recovered higher against the US Dollar.
- The price climbed above the $155 and $158 resistance levels to move into a positive zone.
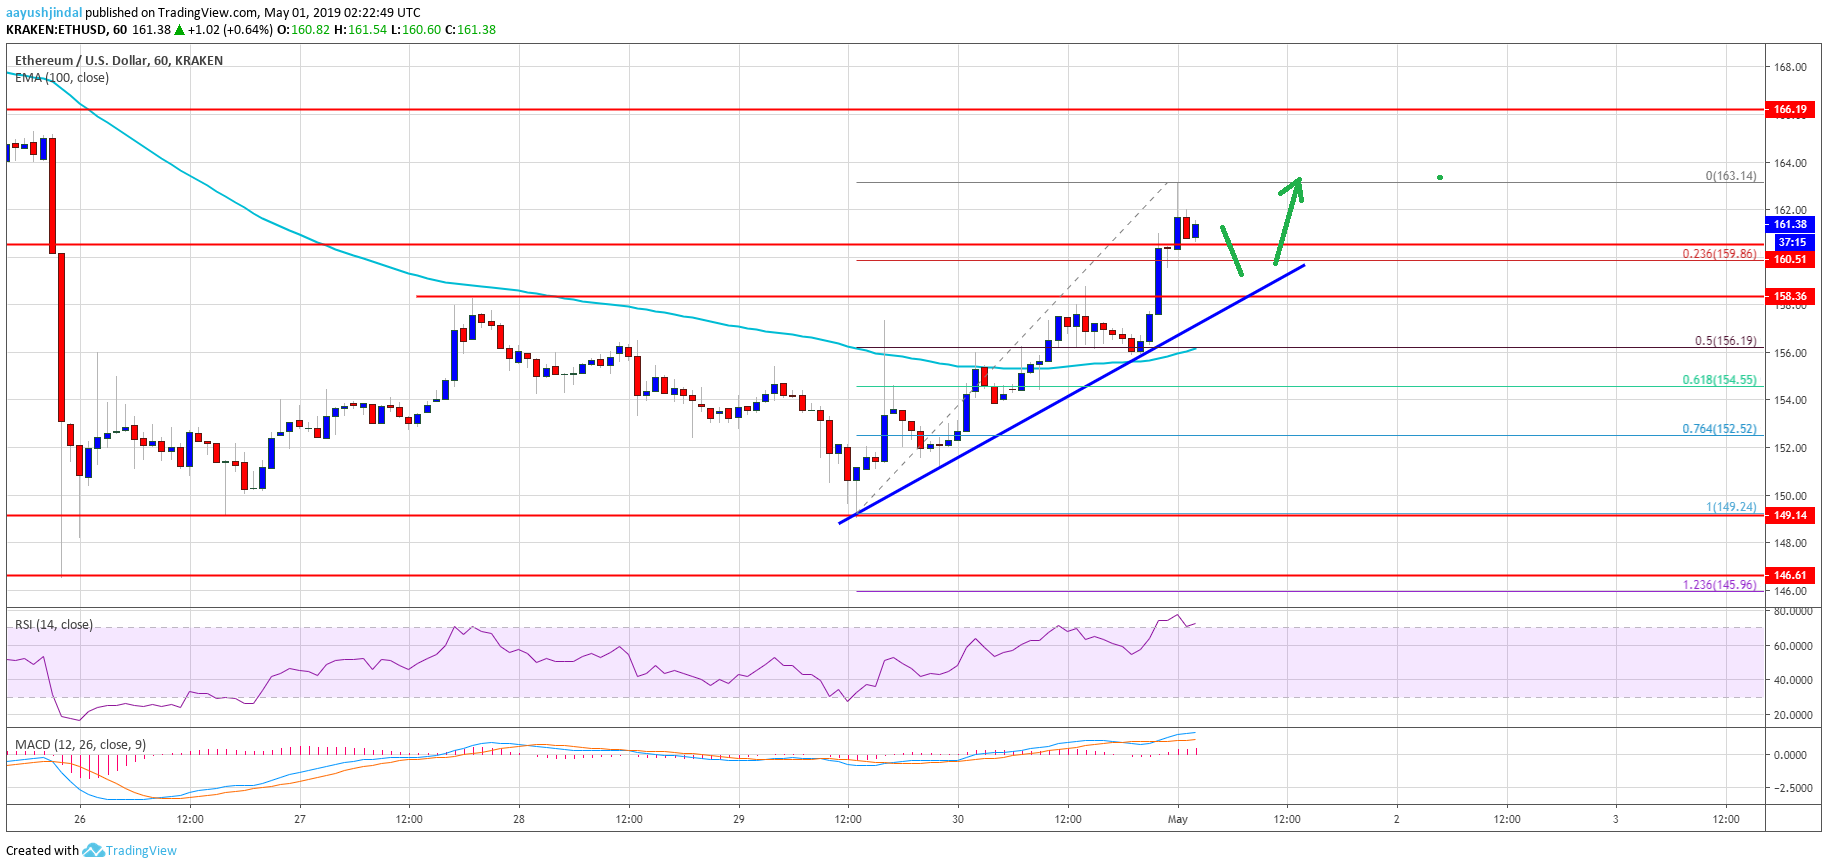
- There is a connecting bullish trend line forming with support near $158 on the hourly chart of ETH/USD (data feed via Kraken).
- The pair is currently trading with a positive bias and it could recover towards $165 and $170.
Ethereum price started a decent rebound versus the US Dollar and bitcoin. ETH is now placed nicely above $158 and it may continue to rise towards the $170 resistance area.
Ethereum Price Analysis
Yesterday, there was a decent upward move in Ethereum price above the $154 and $155 resistances against the US Dollar. The ETH/USD pair even settled above the $155 level and the 100 hourly simple moving average. The pair gained bullish momentum and even broke the $158 resistance and the $159 swing high. It opened the doors for more gains above the $160 level and the 1.236 Fib extension level of the last drop from the $159 high to $150 swing low.
The price traded towards the $165 level and formed a swing high near $163. At the moment, the price is correcting lower towards $160. An immediate support is near $160 and the 23.6% Fib retracement level of the recent wave from the $150 swing low to $163 high. Moreover, there is a connecting bullish trend line in place with support near $158 on the hourly chart of ETH/USD. If there is a break below the trend line, the price could test the $156 support level. The 50% Fib retracement level of the recent wave from the $150 swing low to $163 high is near the $156 level.
Besides, the 100 hourly SMA is also close to the $156 support to prevent losses. On the upside, an initial resistance is near the $163 high. The next key resistance is near the $165 level, above which the price could start a strong wave towards the $170 and $172 levels.
Looking at the chart, Ethereum price clearly recovered nicely above the $160 resistance level. In the short term, there might be a downside correction, but dips remain well supported on the downside near the $160, $158 and $156 levels. Overall, the price is likely to extend gains above the $163 swing high as long as it is trading above the $158 support level.
ETH Technical Indicators
Hourly MACD – The MACD for ETH/USD is now placed nicely in the bullish zone.
Hourly RSI – The RSI for ETH/USD jumped above the 60 level and is currently above 70.
Major Support Level – $158
Major Resistance Level – $165


