
Reason to trust
How Our News is Made
Strict editorial policy that focuses on accuracy, relevance, and impartiality
Ad discliamer
Morbi pretium leo et nisl aliquam mollis. Quisque arcu lorem, ultricies quis pellentesque nec, ullamcorper eu odio.
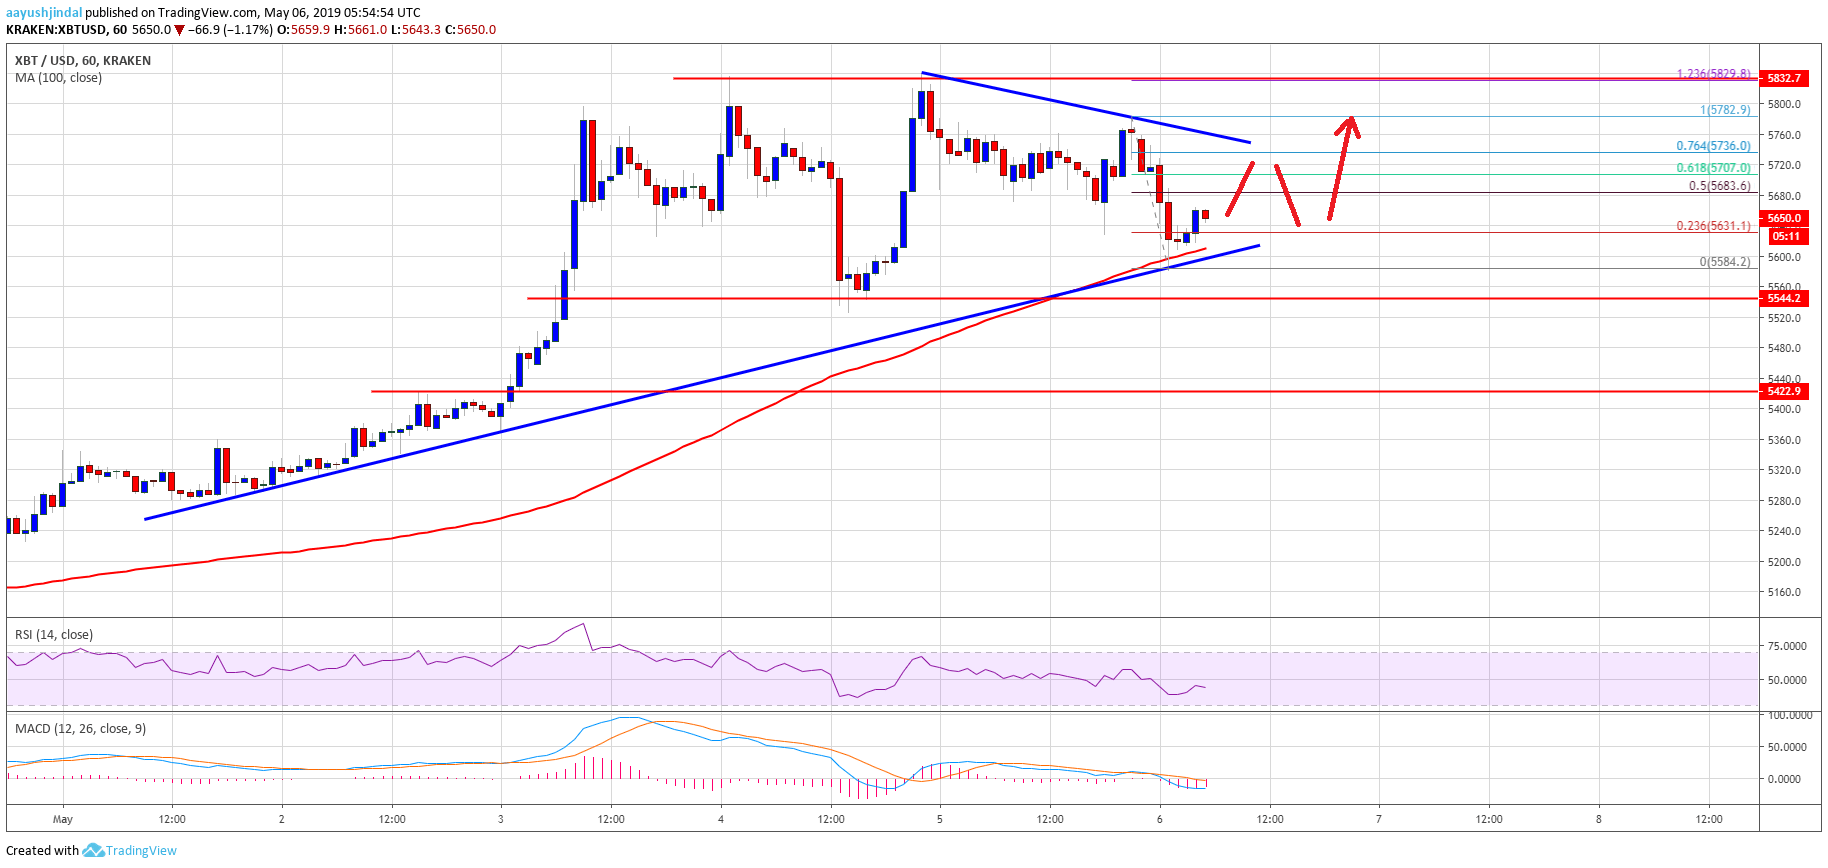
- Bitcoin price corrected lower recently after trading above the $5,800 level against the US Dollar.
- The price declined below the $5,700 level and tested an important support near $5,580.
- There is a key bullish trend line forming with support near $5,600 on the hourly chart of the BTC/USD pair (data feed from Kraken).
- The pair is likely to bounce back above $5,700 as long as it is above $5,600 and $5,540.
Bitcoin price remains well supported on the downside above $5,500 against the US Dollar. BTC could start a fresh rise if it clears the $5,700 and $5,780 resistance levels.
Bitcoin Price Analysis
This past week, we saw a strong rise in bitcoin price above the $5,700 resistance against the US Dollar. The BTC/USD pair even broke the $5,800 level and settled well above the 100 hourly simple moving average. The price traded to a new 2019 at $5,837 and recently started a downside correction. It traded below the $5,700 support and the $5,650 pivot level. However, the price remained well bid above the $5,540 and $5,580 support levels.
More importantly, the price is holding the 100 hourly simple moving average and is currently above $5,600. There is also a key bullish trend line forming with support near $5,600 on the hourly chart of the BTC/USD pair. An immediate resistance is near $5,685, and the 50% Fib retracement level of the recent decline from the $5,782 high to $5,584 low. However, the main resistance is near the $5,760 level and a connecting bearish trend line on the same chart. A successful close above $5,760 and $5,780 might push the price above the $5,800 and $5,850 levels.
On the downside, the main support is near the $5,600 level and the 100 hourly SMA. Below $5,600, the next key support is near the $5,540 level, where the bulls may emerge. If there is a downside break below $5,540, the price may revisit the last line of defense near $5,420. Any further losses may push the price in a short term bearish zone towards $5,200 or $5,100.
Looking at the chart, bitcoin price is currently trading above important support near $5,600 and $5,580. Therefore, there are high chances of a fresh rise above $5,700 and $5,760. If the bulls regain momentum, the price could even trade to a new 2019 high above the $5,850 level in the coming sessions.
Technical indicators:
Hourly MACD – The MACD is currently placed in the bearish zone, with a few negative signs.
Hourly RSI (Relative Strength Index) – The RSI for BTC/USD is currently recovering, but it is still well below the 50 level.
Major Support Levels – $5,600 followed by $5,540.
Major Resistance Levels – $5,680, $5,700 and $5,760.


